See the book, the tape and the news together.
The live order book drawn as a heatmap, the headlines as they land and how SPX reacted to them, the economic calendar and a daily briefing. Everything you glance at between trades.
Screenshots: GWT V2 1.0.3 on simulated market data.
Liquidity Heatmap
Watch where size rests, and where it gets pulled.
Every column is one snapshot of the order book, newest at the right, price up the side. Brighter cells hold more size, so you see where liquidity sits, how long it stays and where it disappears, with every trade drawn on top.
- Walls: unusually large resting orders that have stayed for a while, in two tiers, with faint trails where a wall was pulled.
- Big-trade diamonds with lot counts, plus absorption markers where a wall took heavy aggression and price held.
- Gamma levels, gamma by strike, the Desk's key levels and the community's positions drawn over the book.
- A Simple settings page for the essentials and an Advanced one for every control.
How traders use itScalpers use it to see whether a level is defended or thin before they lean on it, and to spot size being pulled just ahead of price.
Read the Liquidity Heatmap deep dive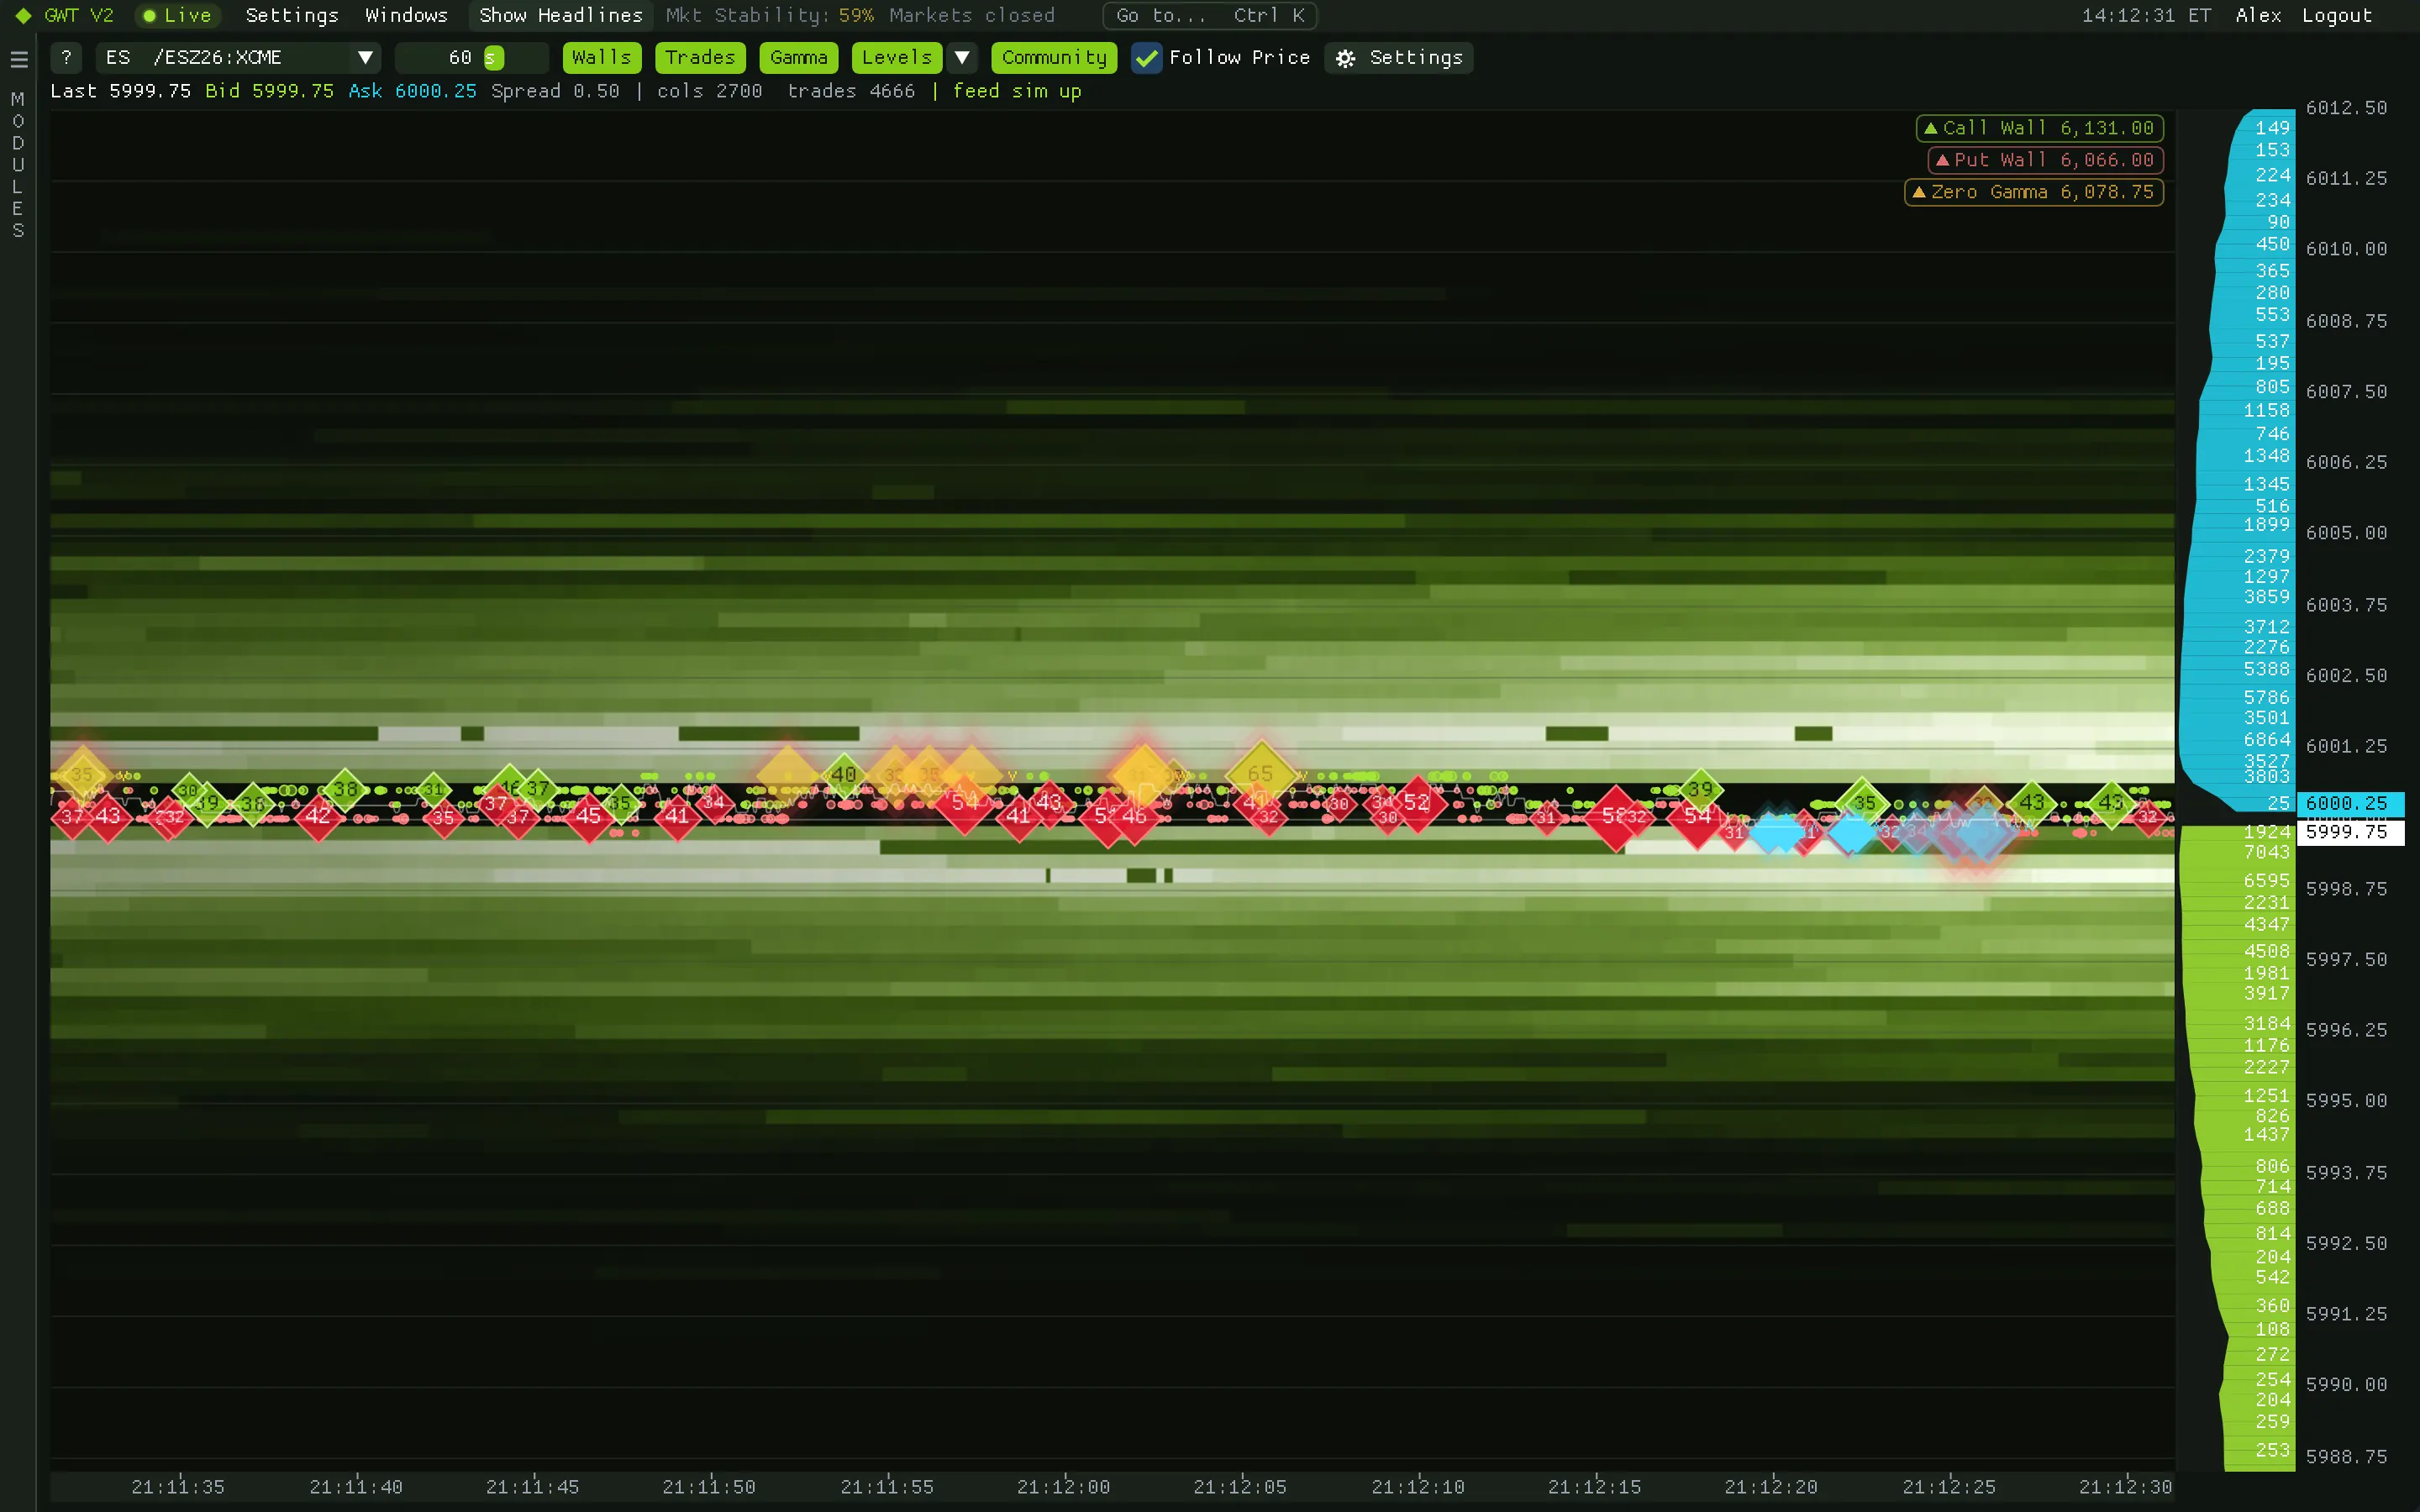
News
Headlines the second they land.
A live feed of market-moving headlines, newest first and timestamped. Filter as you type, and set keywords that highlight matching headlines, raise a banner over whatever module you are in and play an alert sound.
- Live stream with the recent history loaded on open, so you never start from an empty list.
- Keyword alerts with a banner and sound, wherever you are in the app.
- Show Headlines in the menu bar opens a headline drawer over any module.
How traders use itKeep a short keyword list for the day's themes (rates, a central bank, a data release) so only the headlines that can move your market interrupt you.
- U.S. FIGHTER JET STRIKES, DISABLES COMMERCIAL VESSEL IN GULF OF OMAN, PENTAGON SAYS
- AT LEAST 12 KILLED, MORE THAN 300 INJURED IN STRIKE ON RIYADH AIRPORT, SAUDI OFFICIALS SAY
- "PROJECTILE" LANDS NEAR SAUDI'S DAMMAM AIRPORT, SAUDI MILITARY SAYS
- STATE DEPARTMENT CONDEMNS HOUTHI ATTACK ON RIYADH AIRPORT
- U.S. "MAY" JOIN SAUDI STRIKES ON HOUTHIS, TRUMP SAYS
- MULTIPLE INJURIES IN RIYADH AIRPORT ATTACK, OPERATIONS SUSPENDED
- AIRPORT IN SAUDI CAPITAL HAS BEEN ATTACKED AGAIN, OFFICIALS SAY
- YEMENI GOVERNMENT FORCES GAINING GROUND ON HOUTHIS NEAR KEY WATERWAY
- PUTIN RELAYED IRAN'S POSITION ON PEACE DEAL TO TRUMP, KREMLIN SAYS
News Impact
Did that headline actually move the market?
News Impact pins every headline that matches your keywords to the SPX chart at the time it arrived, and reads the index move over the next five minutes. Each marker is one event and its reaction, in index points.
- Your keyword list decides which headlines appear, so the chart shows only the themes you track.
- Hover a marker for the headline, the price at that moment and the five-minute move.
- Shift the markers by an offset when the feed lands a few seconds before or after the candle that reacted.
How traders use itAfter a fast move, check which story lined up with the turn. A large move in the same direction means the news was tradable; a flat or reversed one means it was already priced in.
Calendar
Know what is scheduled before it hits.
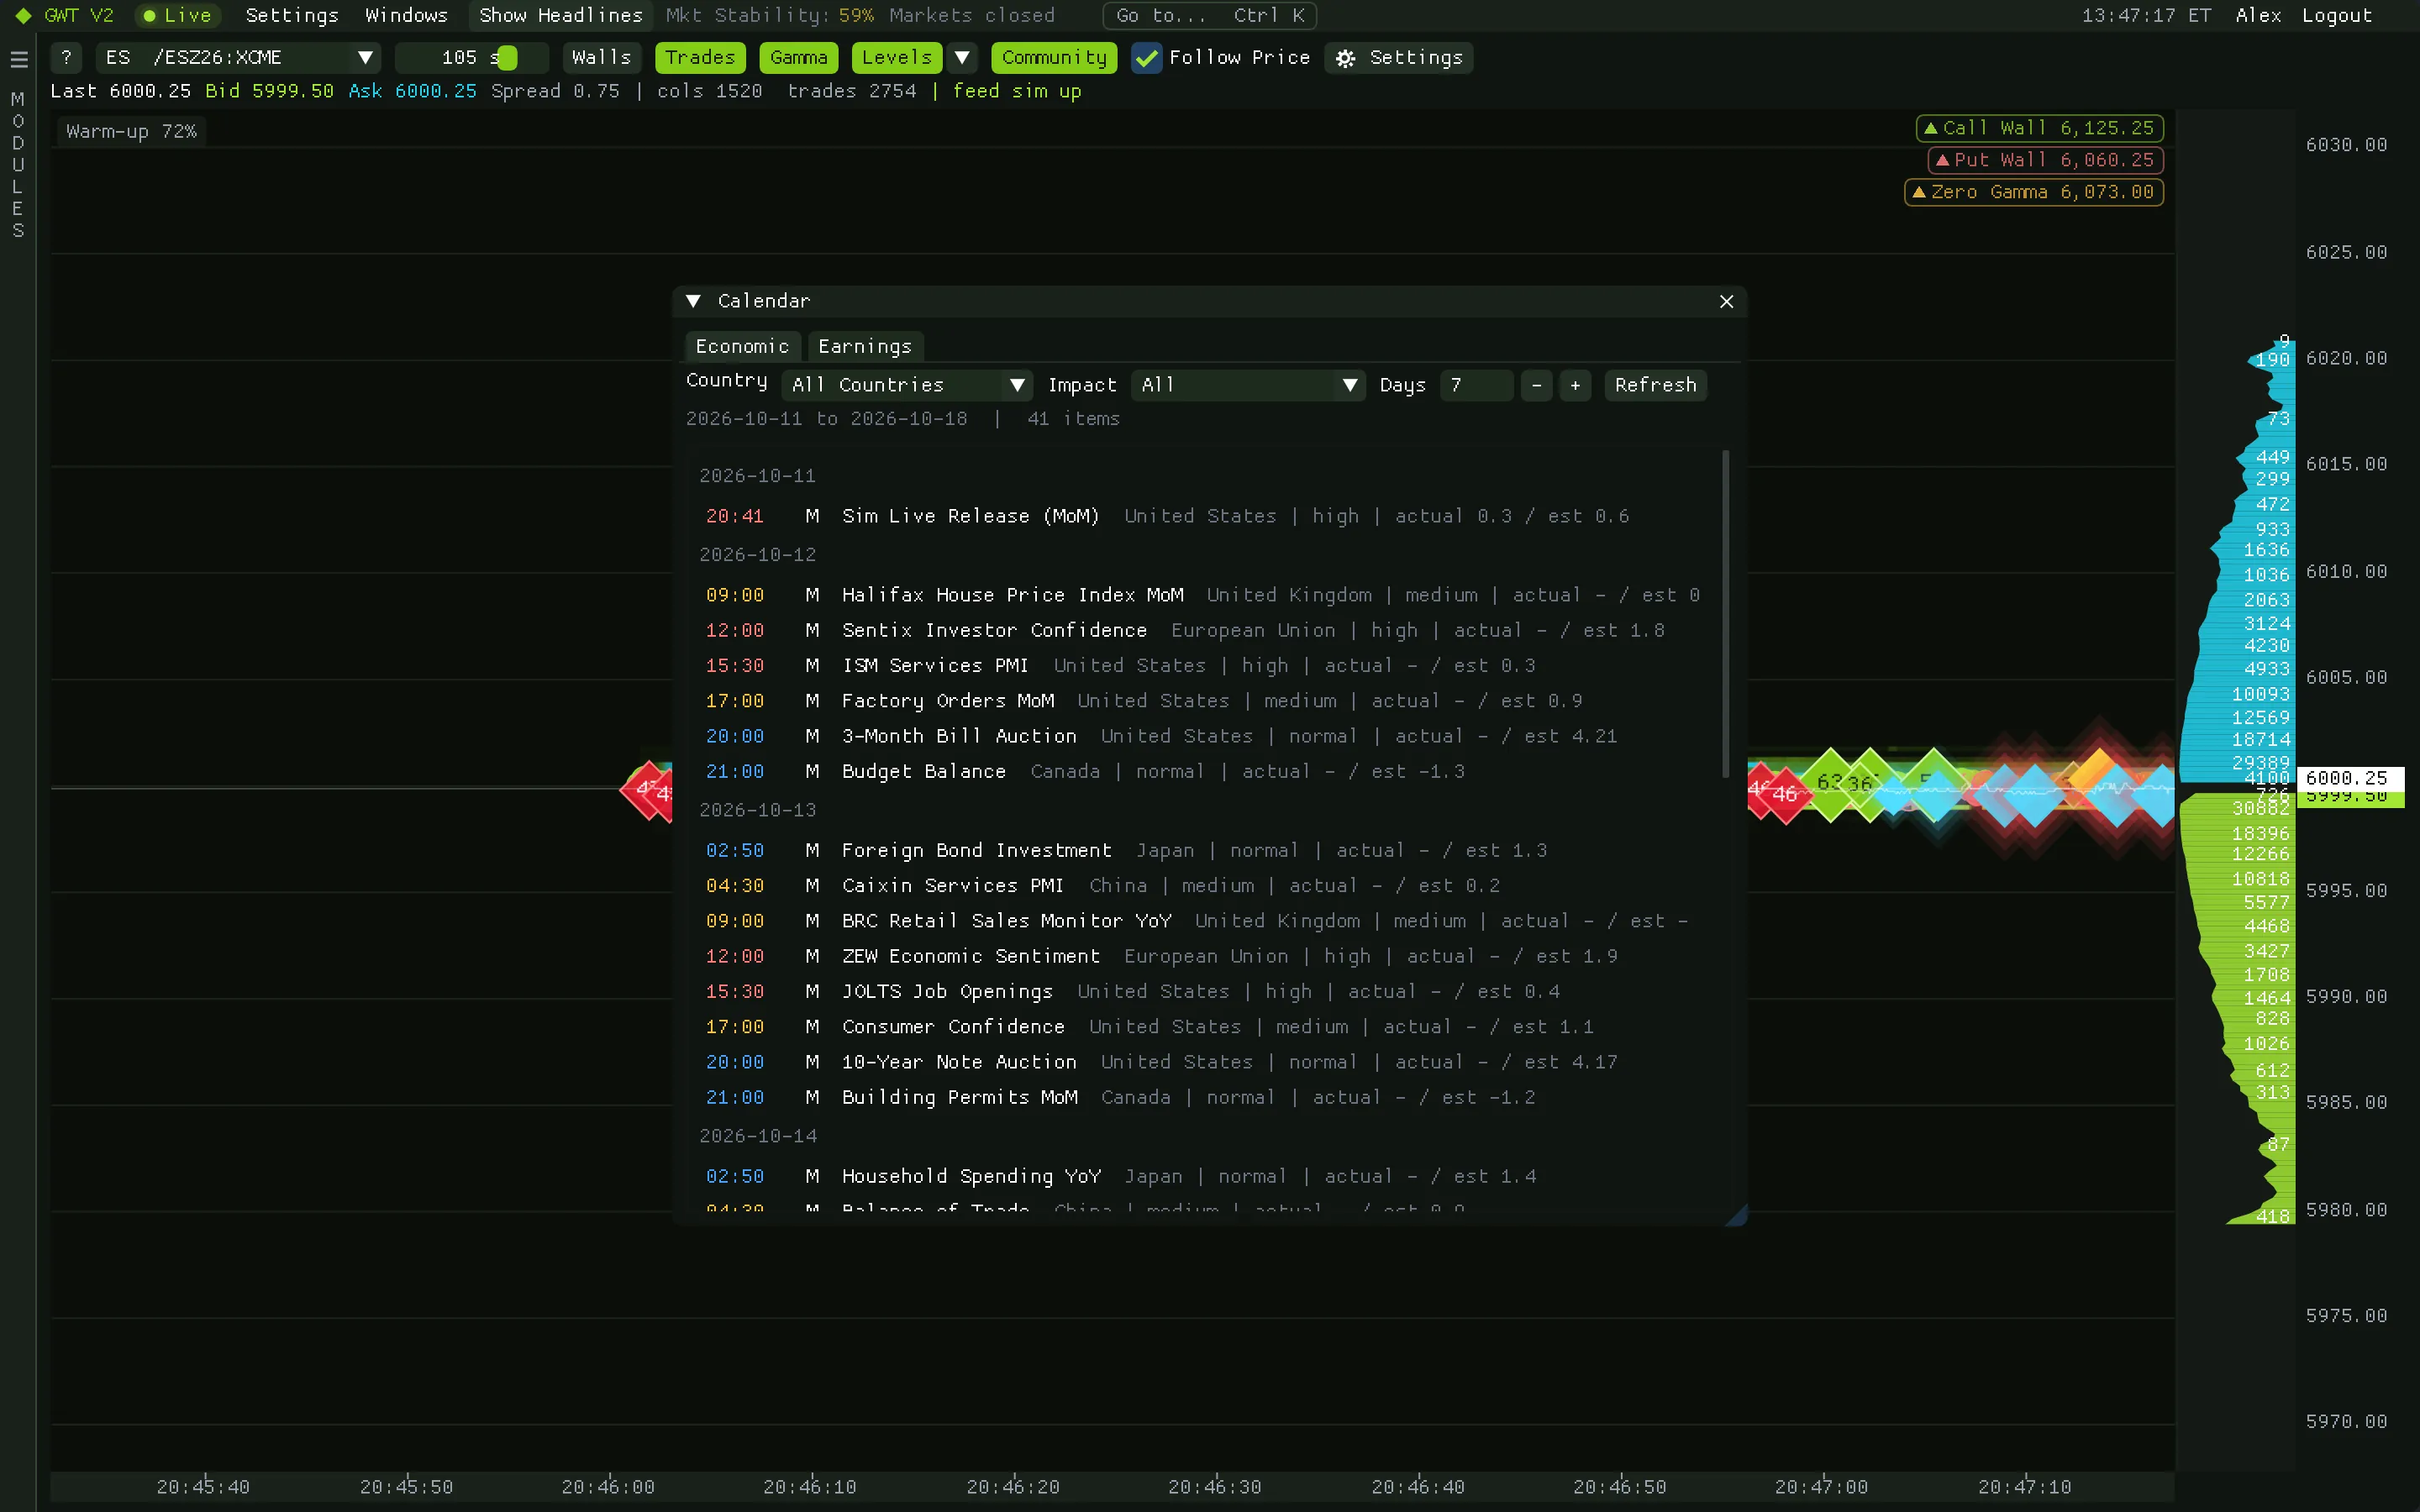
Economic releases and earnings in one floating window, with impact filters and a live countdown to the next release. The same events appear as dots on the Desk's session line and in the sidebar's Next Events card.
- Economic calendar and earnings together, filtered by importance.
- Countdown to the next release, so a number never catches you mid-trade.
- Opens over any module and remembers where you left it.
Market Summary
The day's narrative in two minutes.
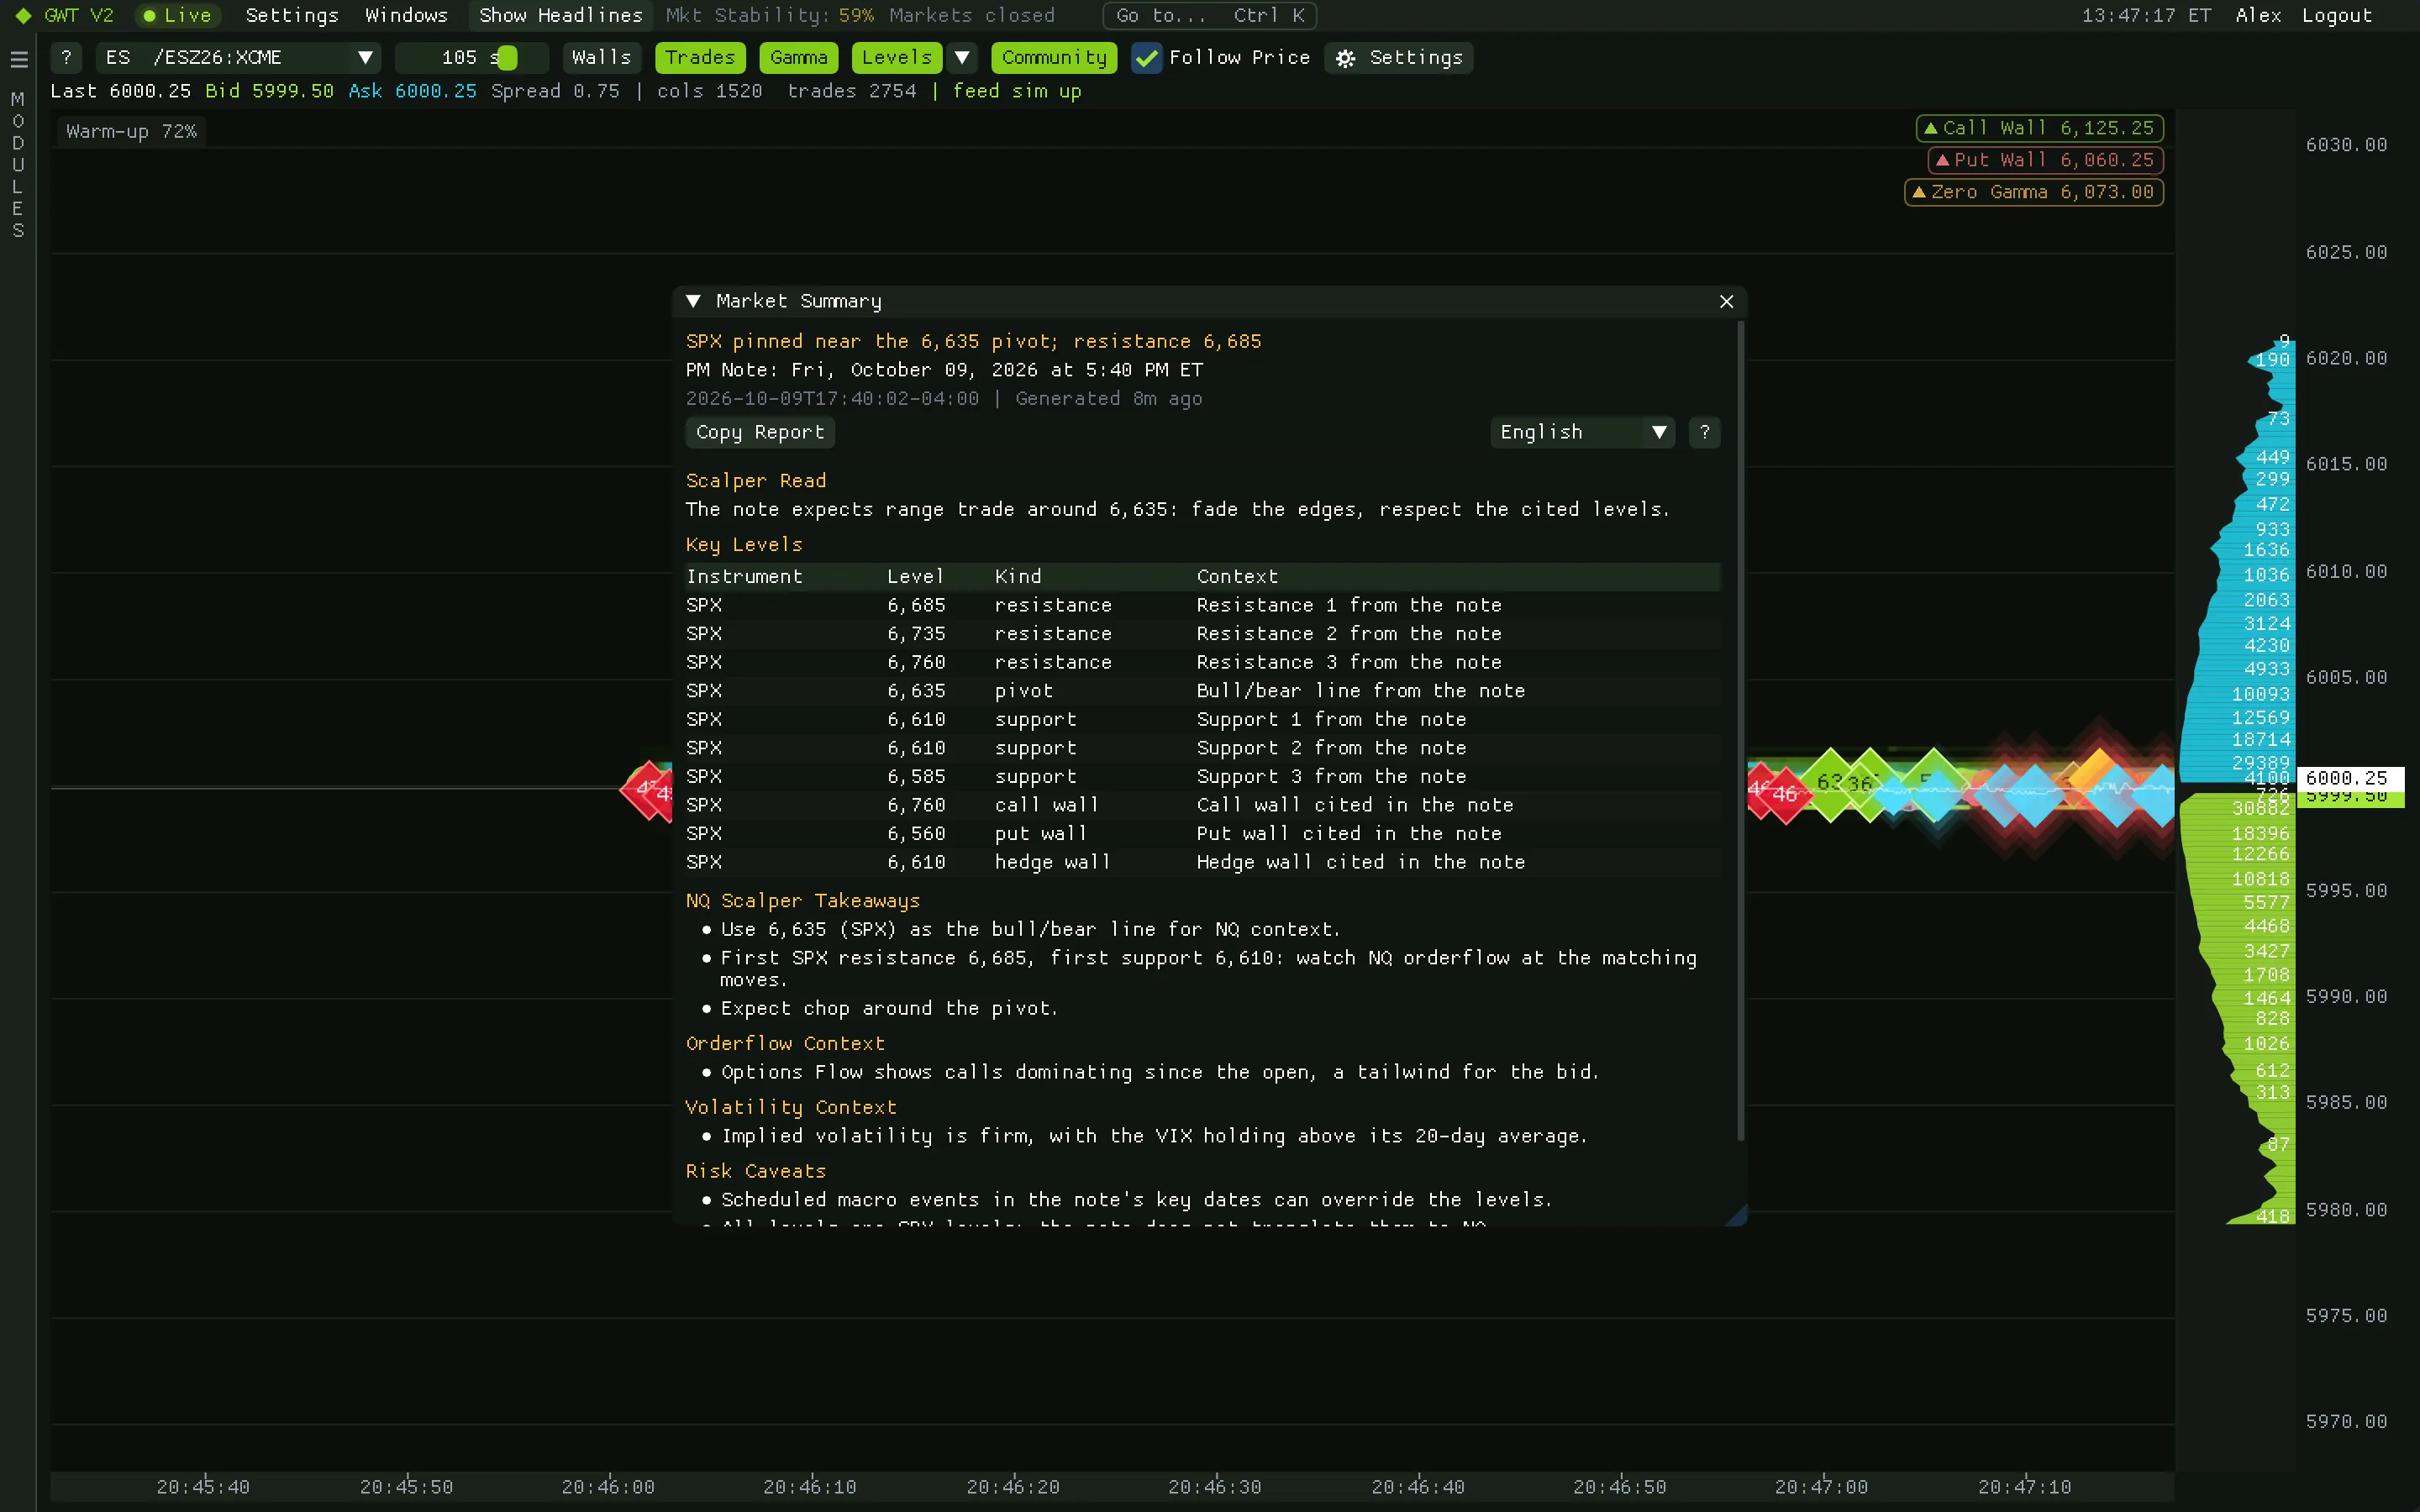
An AI-condensed briefing of the latest professional options-market research note, written for index-futures scalpers: a headline, a short scalper read, a key levels table and context on orderflow, volatility, takeaways and risks. Read it in English, French or Chinese.
- Key levels table with the areas other participants are watching.
- Orderflow, volatility and risk sections, plus the limits of the source, so you know how much weight to give it.
- English, French or Chinese at the click of a button.
How traders use itRead it at the start of the session and after big news for the why behind the tape, then confirm the levels live on the order book and flow before acting.
Keep exploring
Related modules
Ready when the open is
Put gamma, flow and liquidity on one screen.
Get your access token, download the app for your Mac or PC and paste the token at sign-in. It takes about two minutes.