Trade alongside other members, in points.
Members who share their trades show up in a live feed, in an open-positions list with targets and stops, on normalized leaderboards and in a full stats sheet. Only points and per-contract figures are shared. Your dollar totals stay on your own screen.
Screenshots: GWT V2 1.0.3 on simulated market data.
Feed and Positions
See what members are doing as they do it.
The Feed lists every member's orders, fills, positions and closed trades, newest first. A closed trade shows its direction, points per contract, hold time, prices and size. Positions lists every open position with its account type and the nearest take-profit and stop-loss among the member's working orders.
- Live, demo and replay accounts labelled, so you know what you are looking at.
- Filter by contract root, or clear the view to start from now.
- Toasts over any module for the events you choose, such as a new position or a closed trade.
Leaderboard
Ranked fairly, whatever size you trade.
Members are ranked for today, this week, this month or all time on five boards. Net per contract normalizes to a full-size contract, so micro and full-size traders compare on equal terms.

Net per contract
Dollars per full-size contract equivalent, so position size doesn't decide the ranking.
Profit factor and win rate
Gross profit over gross loss, and the share of winning trades.
Consistency and score
How little of the period's result came from one best day, and a system-quality score that rewards a steady edge over many trades.
A member needs a minimum number of trades in the period to be ranked, and Live only keeps trades from live accounts.
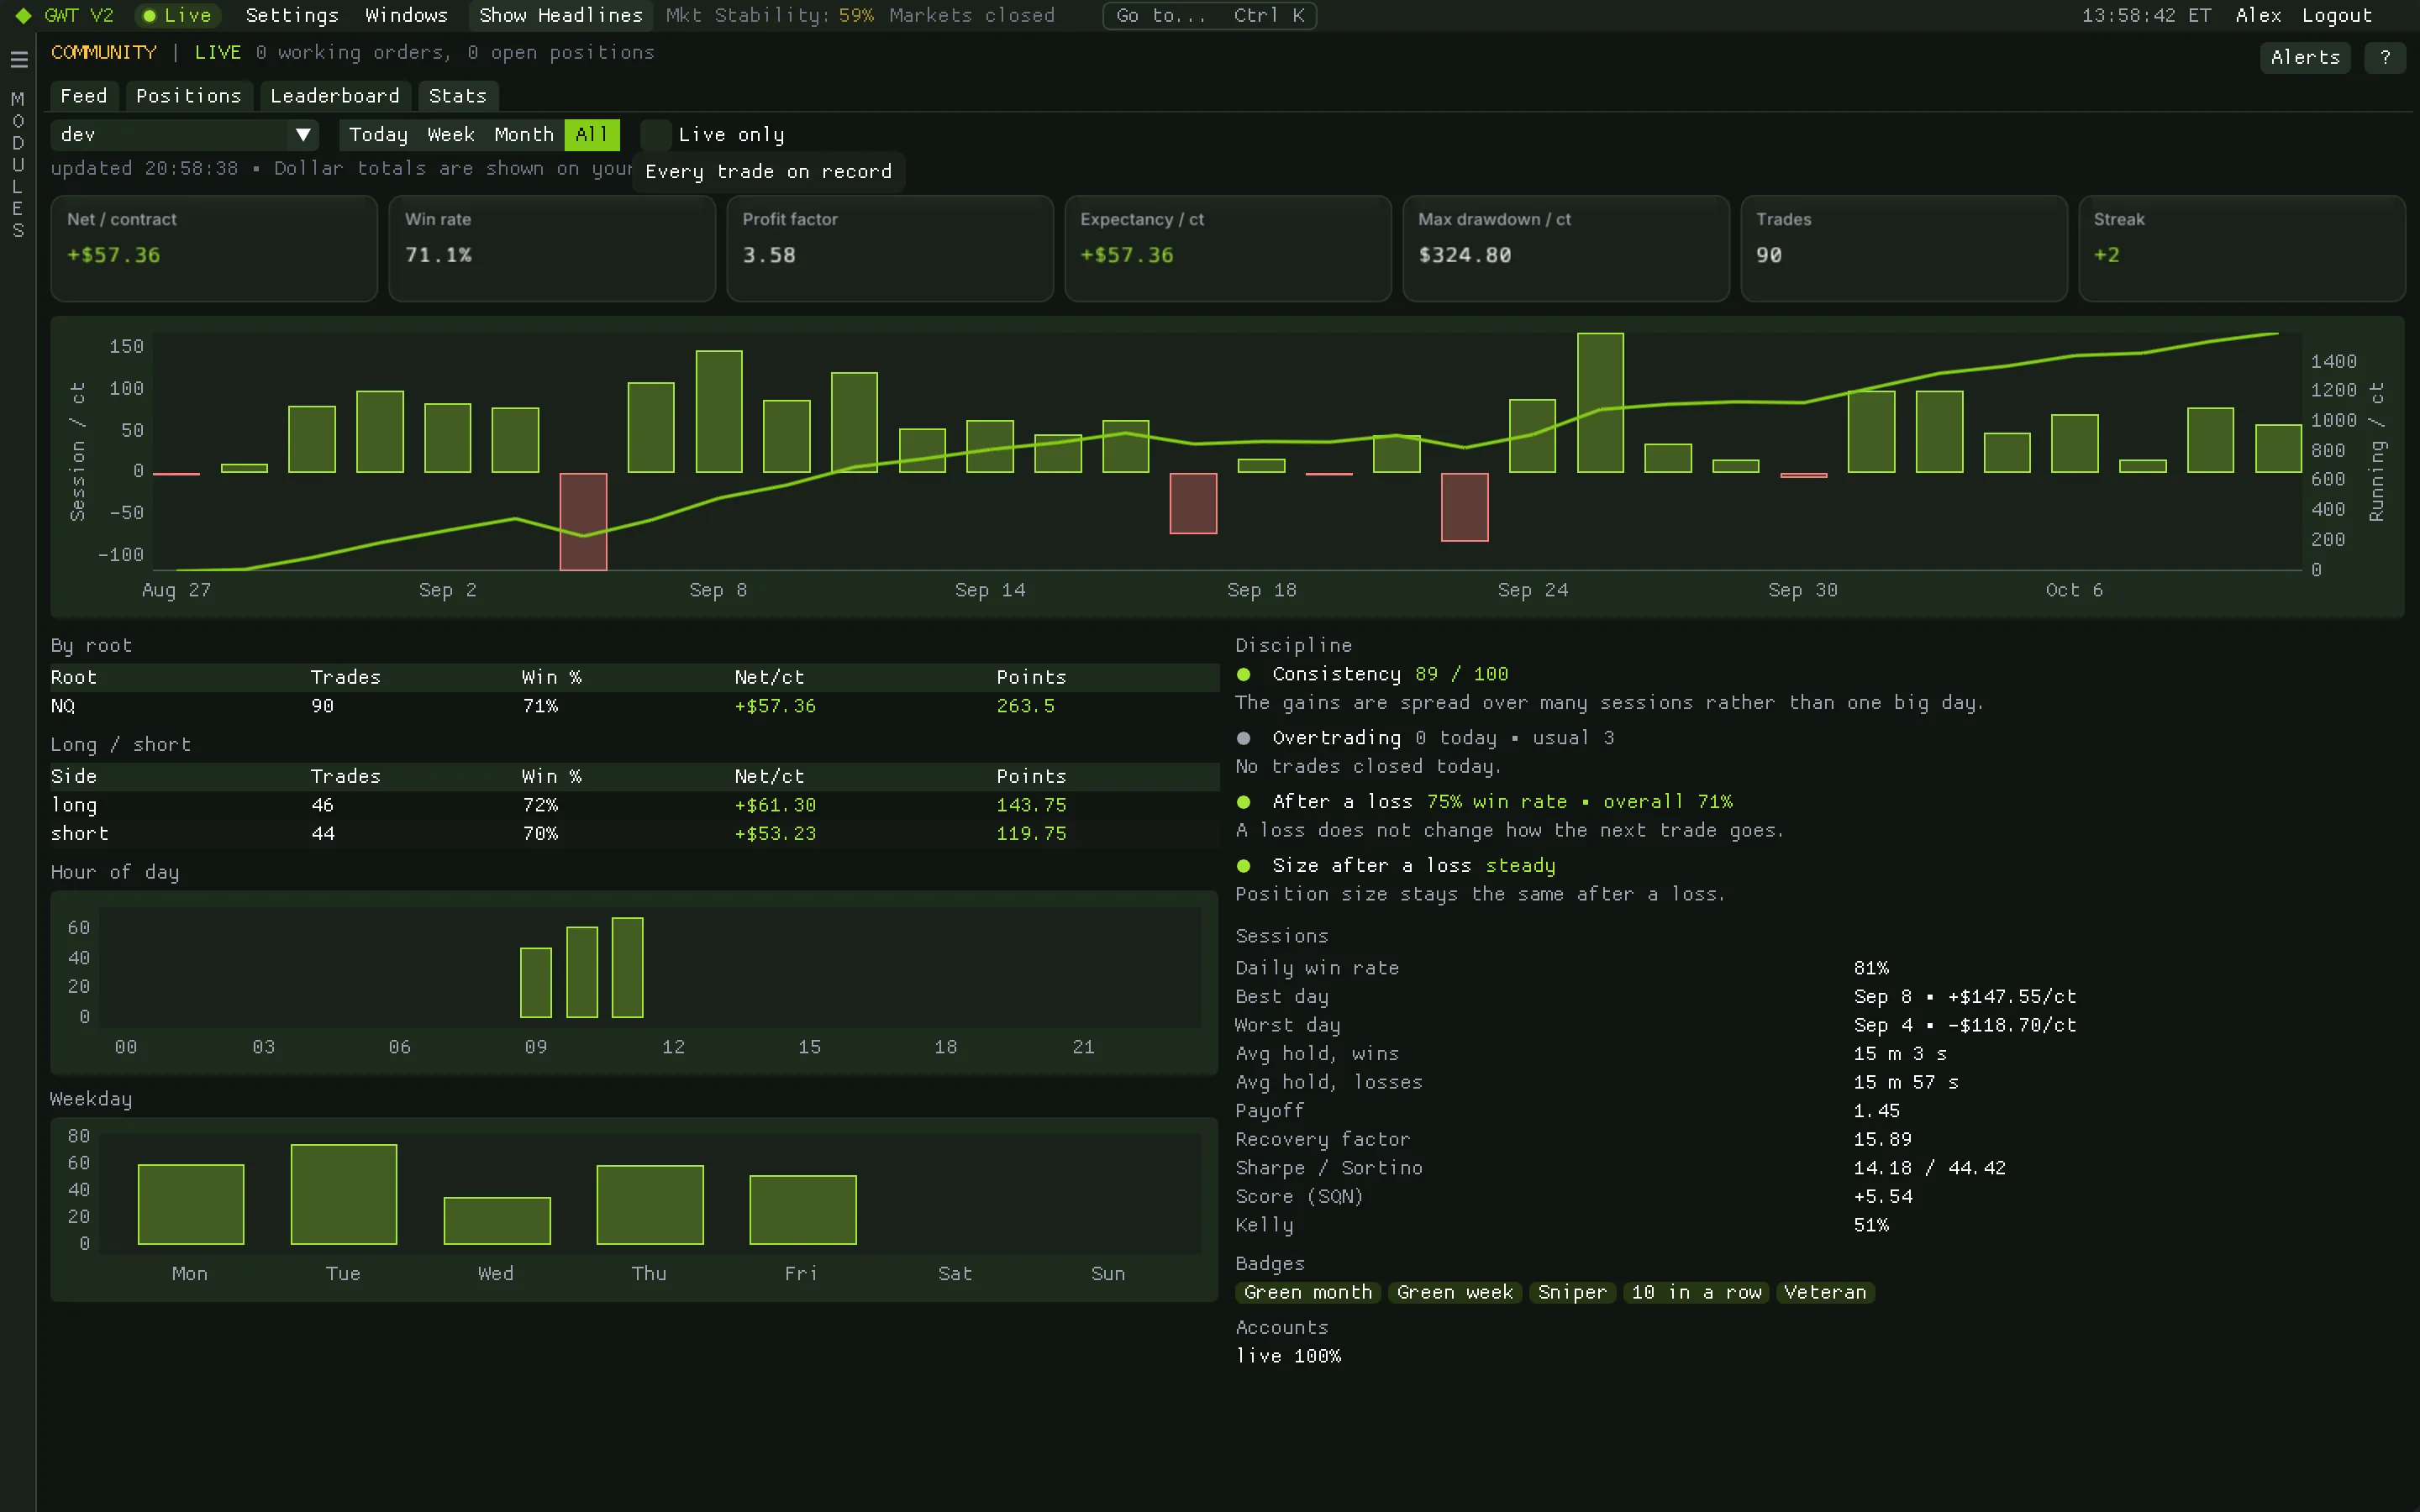
Stats
A full stats sheet for every member.
Open anyone's stats from the leaderboard: headline figures, an equity curve by session, the breakdown by contract, direction, hour of day and weekday, a discipline panel, badges and the account mix.
How traders use itCheck your own sheet after a bad day. If your win rate right after a loss is far below your usual one, you are probably chasing.
- Performance. Win rate, profit factor, expectancy, max drawdown, Sharpe and Sortino, payoff and streaks.
- Discipline. Consistency across sessions, overtrading against a usual day, and win rate and size after a loss.
- Timing. Results by hour of day and weekday, and average hold time for wins and losses.
- Badges. Milestones such as a green week, a green month or a winning streak.
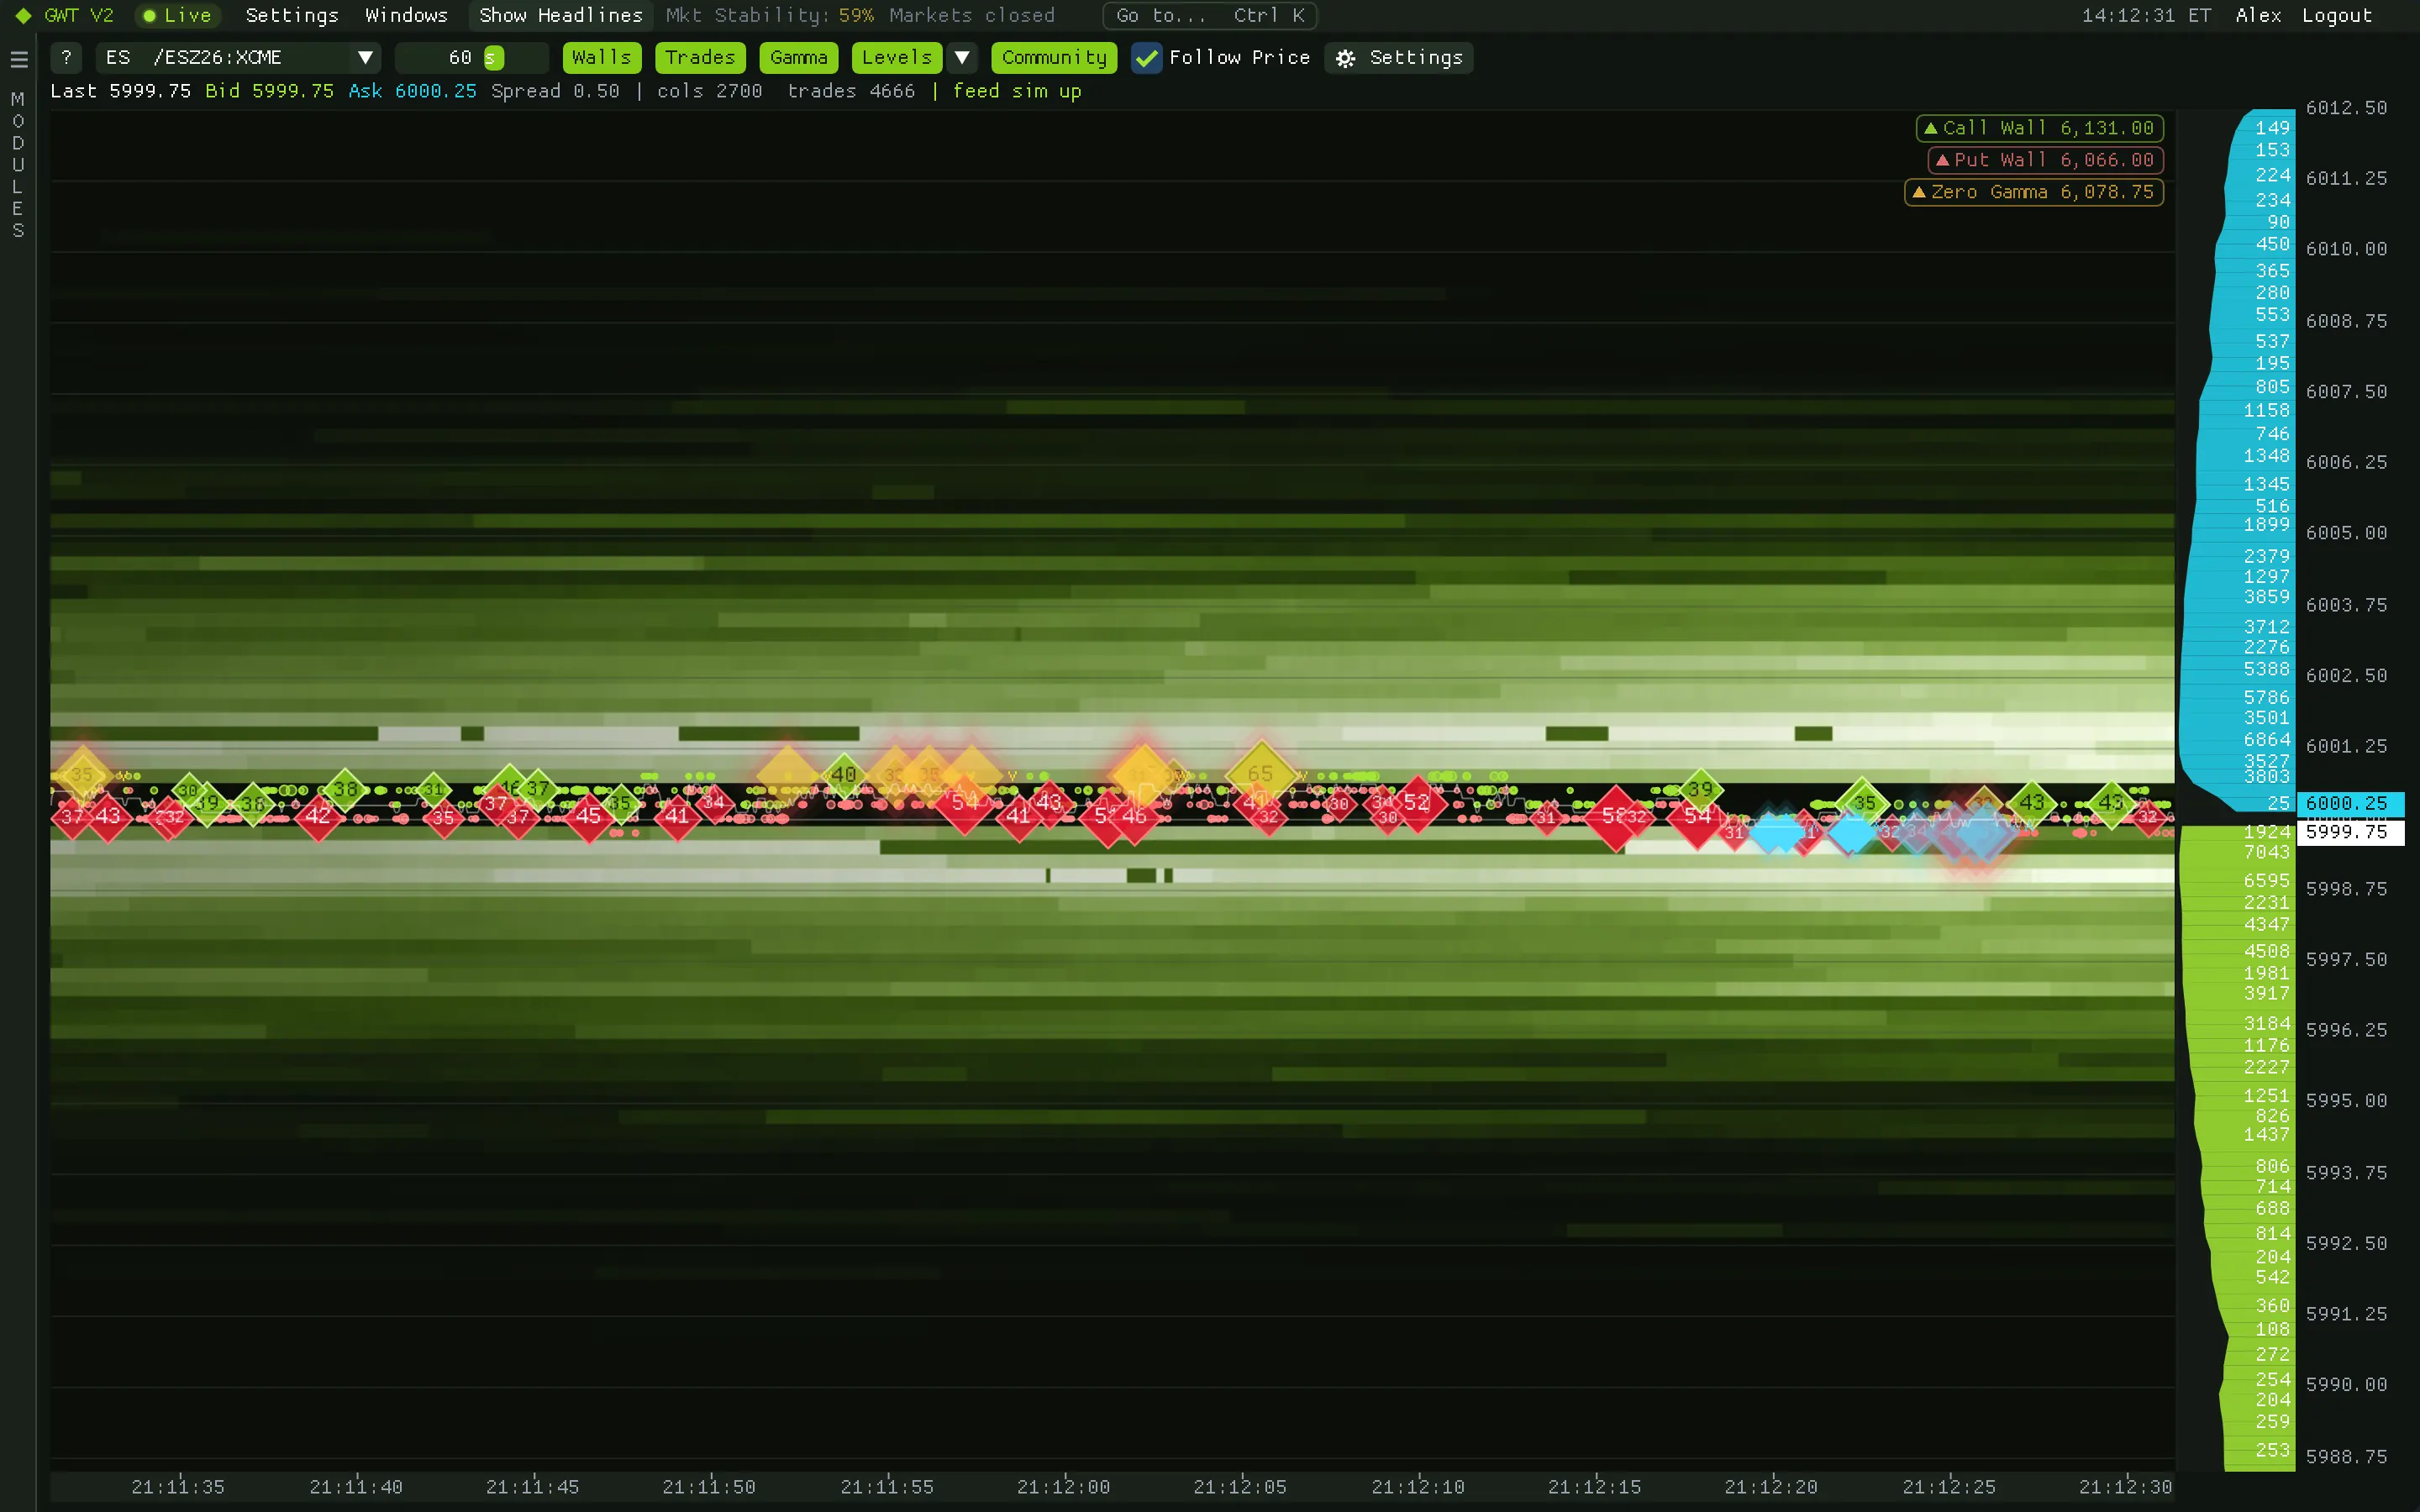
On the heatmap
Members' entries, targets and stops, on the book.
On the Liquidity Heatmap, each member trading the same contract appears where their position entered, with their take-profit and stop-loss tethered to it, and a short sound when someone opens a position. Prefer plain lines? Switch to a style that draws every working order and position.
- One glowing marker per member, pinned to the time and price of their entry.
- Labels with side, size and price in the lines style.
- One switch in the heatmap header turns the overlay on or off.
Sharing your trades
Share from ATAS, keep your dollars private.
Trades reach the community through the GWTV2 plugin for ATAS: its GEX Levels indicator shares your chart's orders, fills and position by default, or you can run the standalone Community indicator. The server builds your closed trades and P&L from the fills.
About the ATAS pluginWhat others see
- Points, per-contract figures, ratios and rates.
- Your nickname, not your account name, once you set one.
- Dollar totals only on your own stats, never in the feed or on anyone else's screen.
- Turn sharing off at any time and your live orders and position leave the feed.
Keep exploring
Related modules
Ready when the open is
Put gamma, flow and liquidity on one screen.
Get your access token, download the app for your Mac or PC and paste the token at sign-in. It takes about two minutes.