The order book, drawn over time.
Every column is one snapshot of the resting orders, newest at the right, with price up the side. Brighter cells hold more size. Within seconds you see where liquidity rests, how long it stays and where it gets pulled, with every trade, wall and gamma level on the same chart.
Screenshots: GWT V2 1.0.3 on simulated market data.
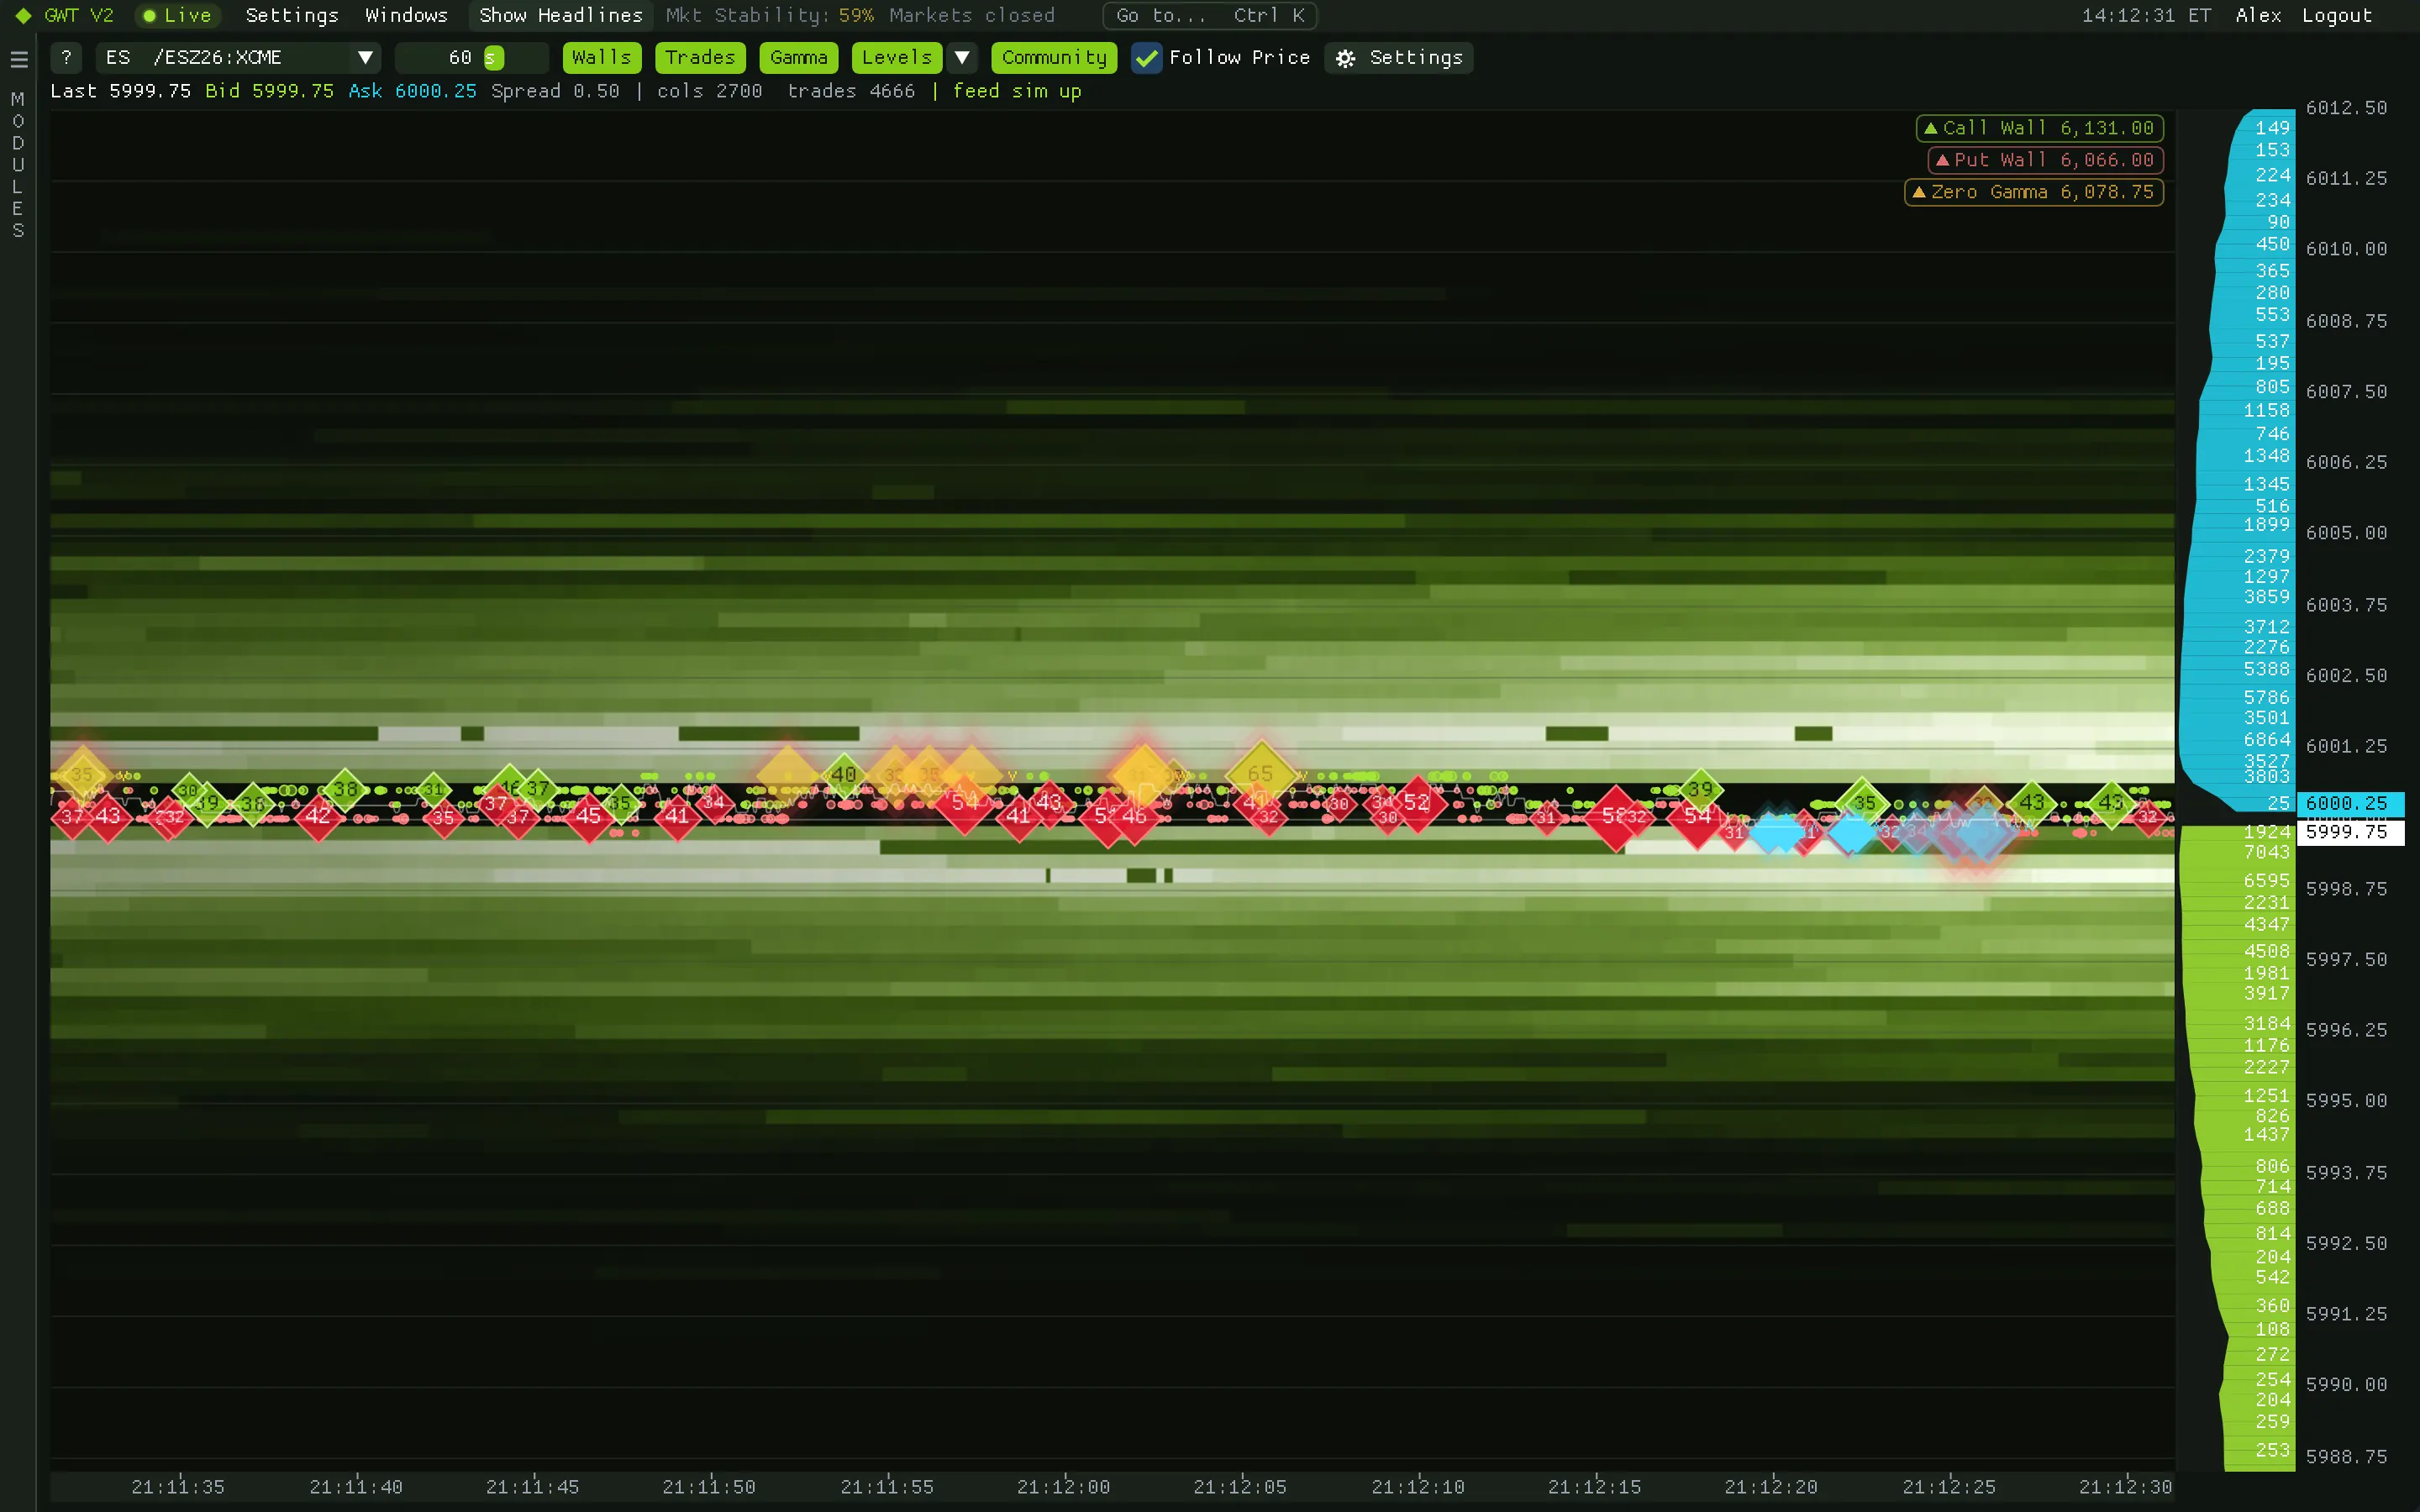
What you are looking at
Four parts, read left to right.
Heatmap history
Resting size per price and time, coloured by the style you pick. The trail of the mid runs through it.
Future projection
An optional strip that stretches the newest book to the right of history, in the same colours.
Order book strip
The depth of the current book as bars, with sizes, so you can read the ladder at a glance.
Price axis
The last trade as a chip, with gamma and key levels named at the edges, even when they sit off screen.
Look
Six ways to colour the book.
The style decides what a colour means. Detail, one slider from Less to More, moves the one setting that matters for the style you chose.
- Standard. One ramp above the price and one below, ending in the ask and bid colours. The default.
- Heat. One colour ramp between two percentile cutoffs of the sizes in view.
- Lifetime. Fresh orders in one ramp, orders that have rested in another.
- Size bands. One colour per order of magnitude: 1, 10, 100 lots and up.
- Walls only. Only the walls; everything else is hidden.
- Classic. Size against one reference percentile, with adjustable contrast.
On the chart
Walls, trades and order flow, drawn where they happen.
Each layer has a switch in the header or on the Simple page, and its own reset.
Walls
Levels far larger than the ordinary size of their column that have rested for a while, in two tiers. Bright means the wall stands now; a faint trail means it was pulled.
Big trades
Diamonds with lot counts for the big trades, added up per price over 50 ms. Filter them by minimum and maximum lots.
Absorption
A diamond where a wall took heavy one-sided aggression and price did not move: cyan when buyers held, yellow when sellers held. Retests make it grow.
Hidden buyers and sellers
Chevrons where little net volume went one way yet the mid moved the other, plus delta flips and stacked imbalances when you switch them on.
Gamma and key levels
Zero gamma and the largest positive and negative strikes, gamma and open interest by strike as bands or a ladder, and any of the Desk's key levels with their alarms.
Community positions
Members trading the same contract appear where they entered, with their take-profits and stops, and a short sound when someone opens a position.
Controls
Made to be steered while price moves.
The chart follows price by default. Pan away and it says so; double-click and it follows again.
- Mouse wheel
- Zoom the price range
- Drag
- Pan price (Shift: also back in time)
- Double-click / F
- Follow price again
- W
- Walls on or off
- [ and ]
- Shorter or longer time window, 1.5 s to 6 min
- F1
- Built-in help
Keep exploring
Related modules
Ready when the open is
Put gamma, flow and liquidity on one screen.
Get your access token, download the app for your Mac or PC and paste the token at sign-in. It takes about two minutes.