Know where dealers have to hedge.
Where options dealers are long gamma, their hedging leans against the move and price tends to slow or pin. Where they are short gamma, hedging adds to the move. These modules show where those zones are, today, across price and time.
Screenshots: GWT V2 1.0.3 on simulated market data.
SPX Gamma Map
A structure map for the S&P 500, minute by minute.
A same-day SPX surface with time across and price up the side. Each cell estimates how stable the market is around that price and time, with candles over it. Switch the lens to delta pressure or charm, and read the Net GEX pane beneath.
- Call wall, put wall, zero gamma, max gamma and the secondary levels drawn across the map.
- Contours that pack tightly where the structure changes fast, the edges that often matter most.
- Condors, the gamma cliff, a strike overlay and price alarms you draw as a box on the map.
- Read every price in SPX or ES points with one toggle.
How traders use itFrame the day: is price sitting in a sticky pocket or a free-travel corridor, and what is waiting above and below it?
Read the SPX Gamma Map deep dive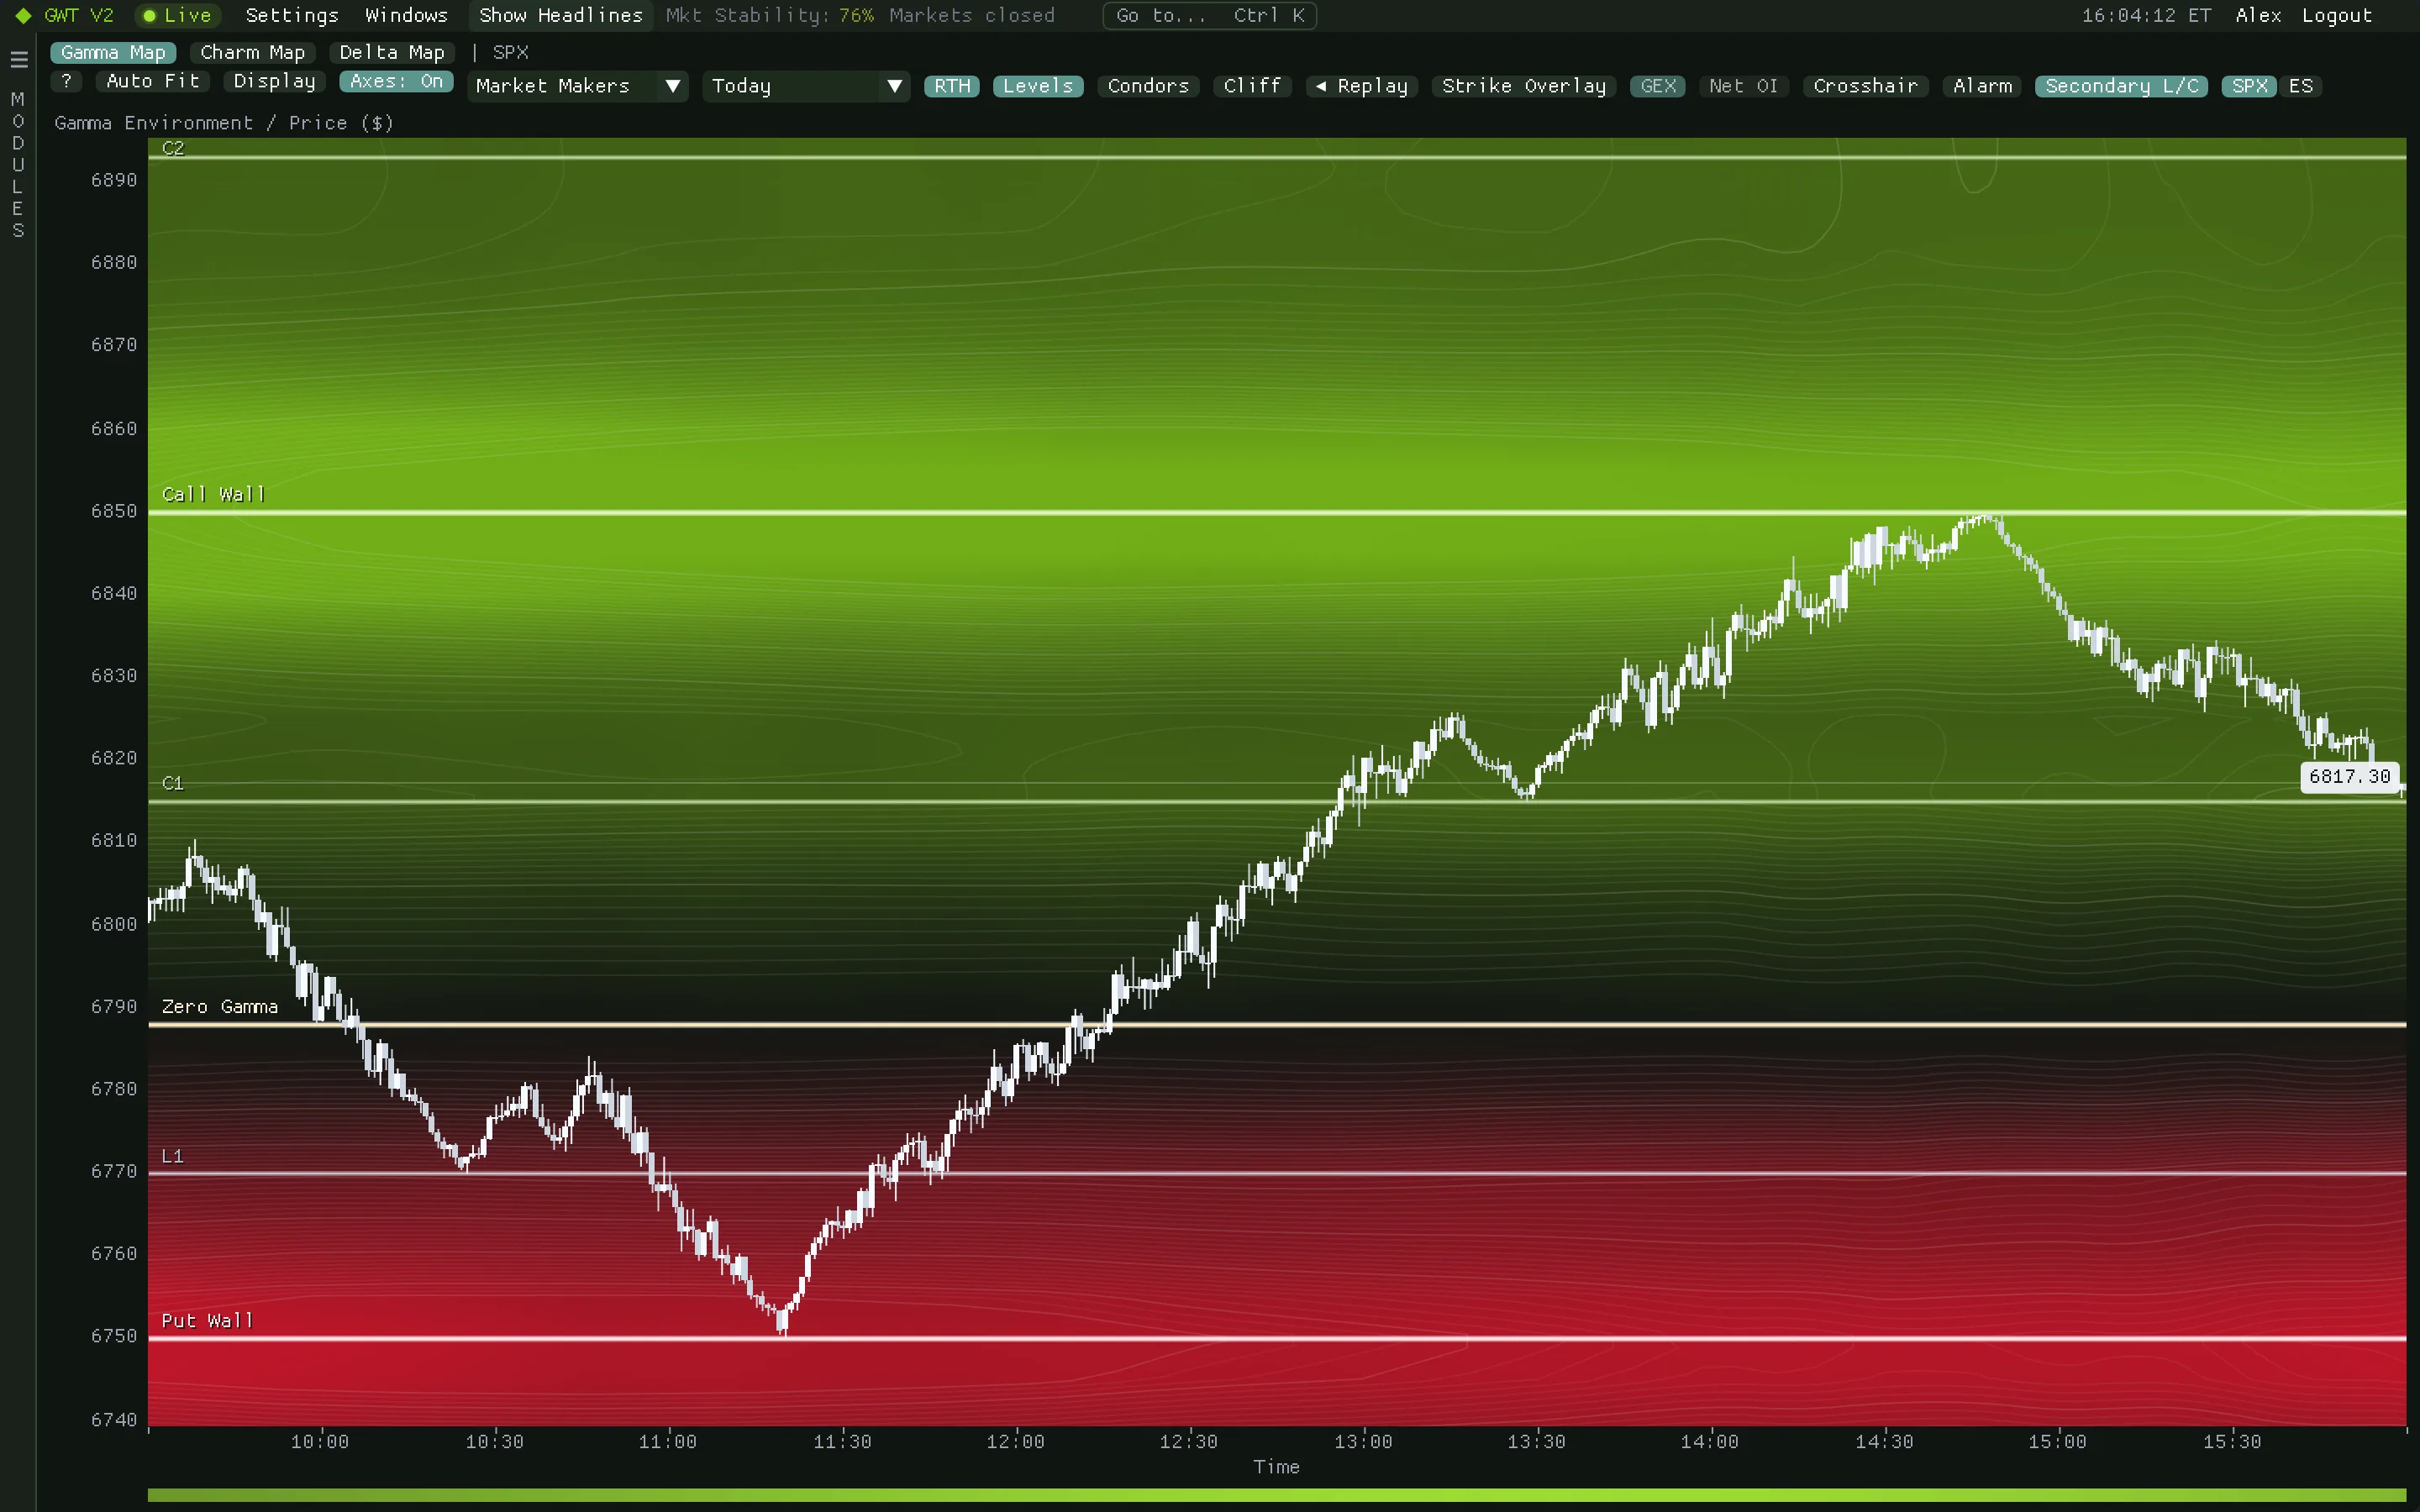
GEX Stack
Four indices, one gamma picture.
The 0DTE call wall, put wall and gamma flip for SPX, NDX, QQQ and SPY side by side, rebuilt every minute from the day's option trades. The confluence ribbon underneath counts how many of the four are testing a wall at once.
- Walls as clouds along their strikes: the stronger the wall, the taller and brighter.
- Big 0DTE trades as bubbles at their strike and minute, bought or sold, with sweeps ringed.
- Corridor cards and big-flow gauges in the Levels view, comparable across all four assets.
- Drag the ribbon to replay the session minute by minute.
How traders use itWhen three or four assets press into their call walls at the same minute, the read is much stronger than one index alone.
Read the GEX Stack deep dive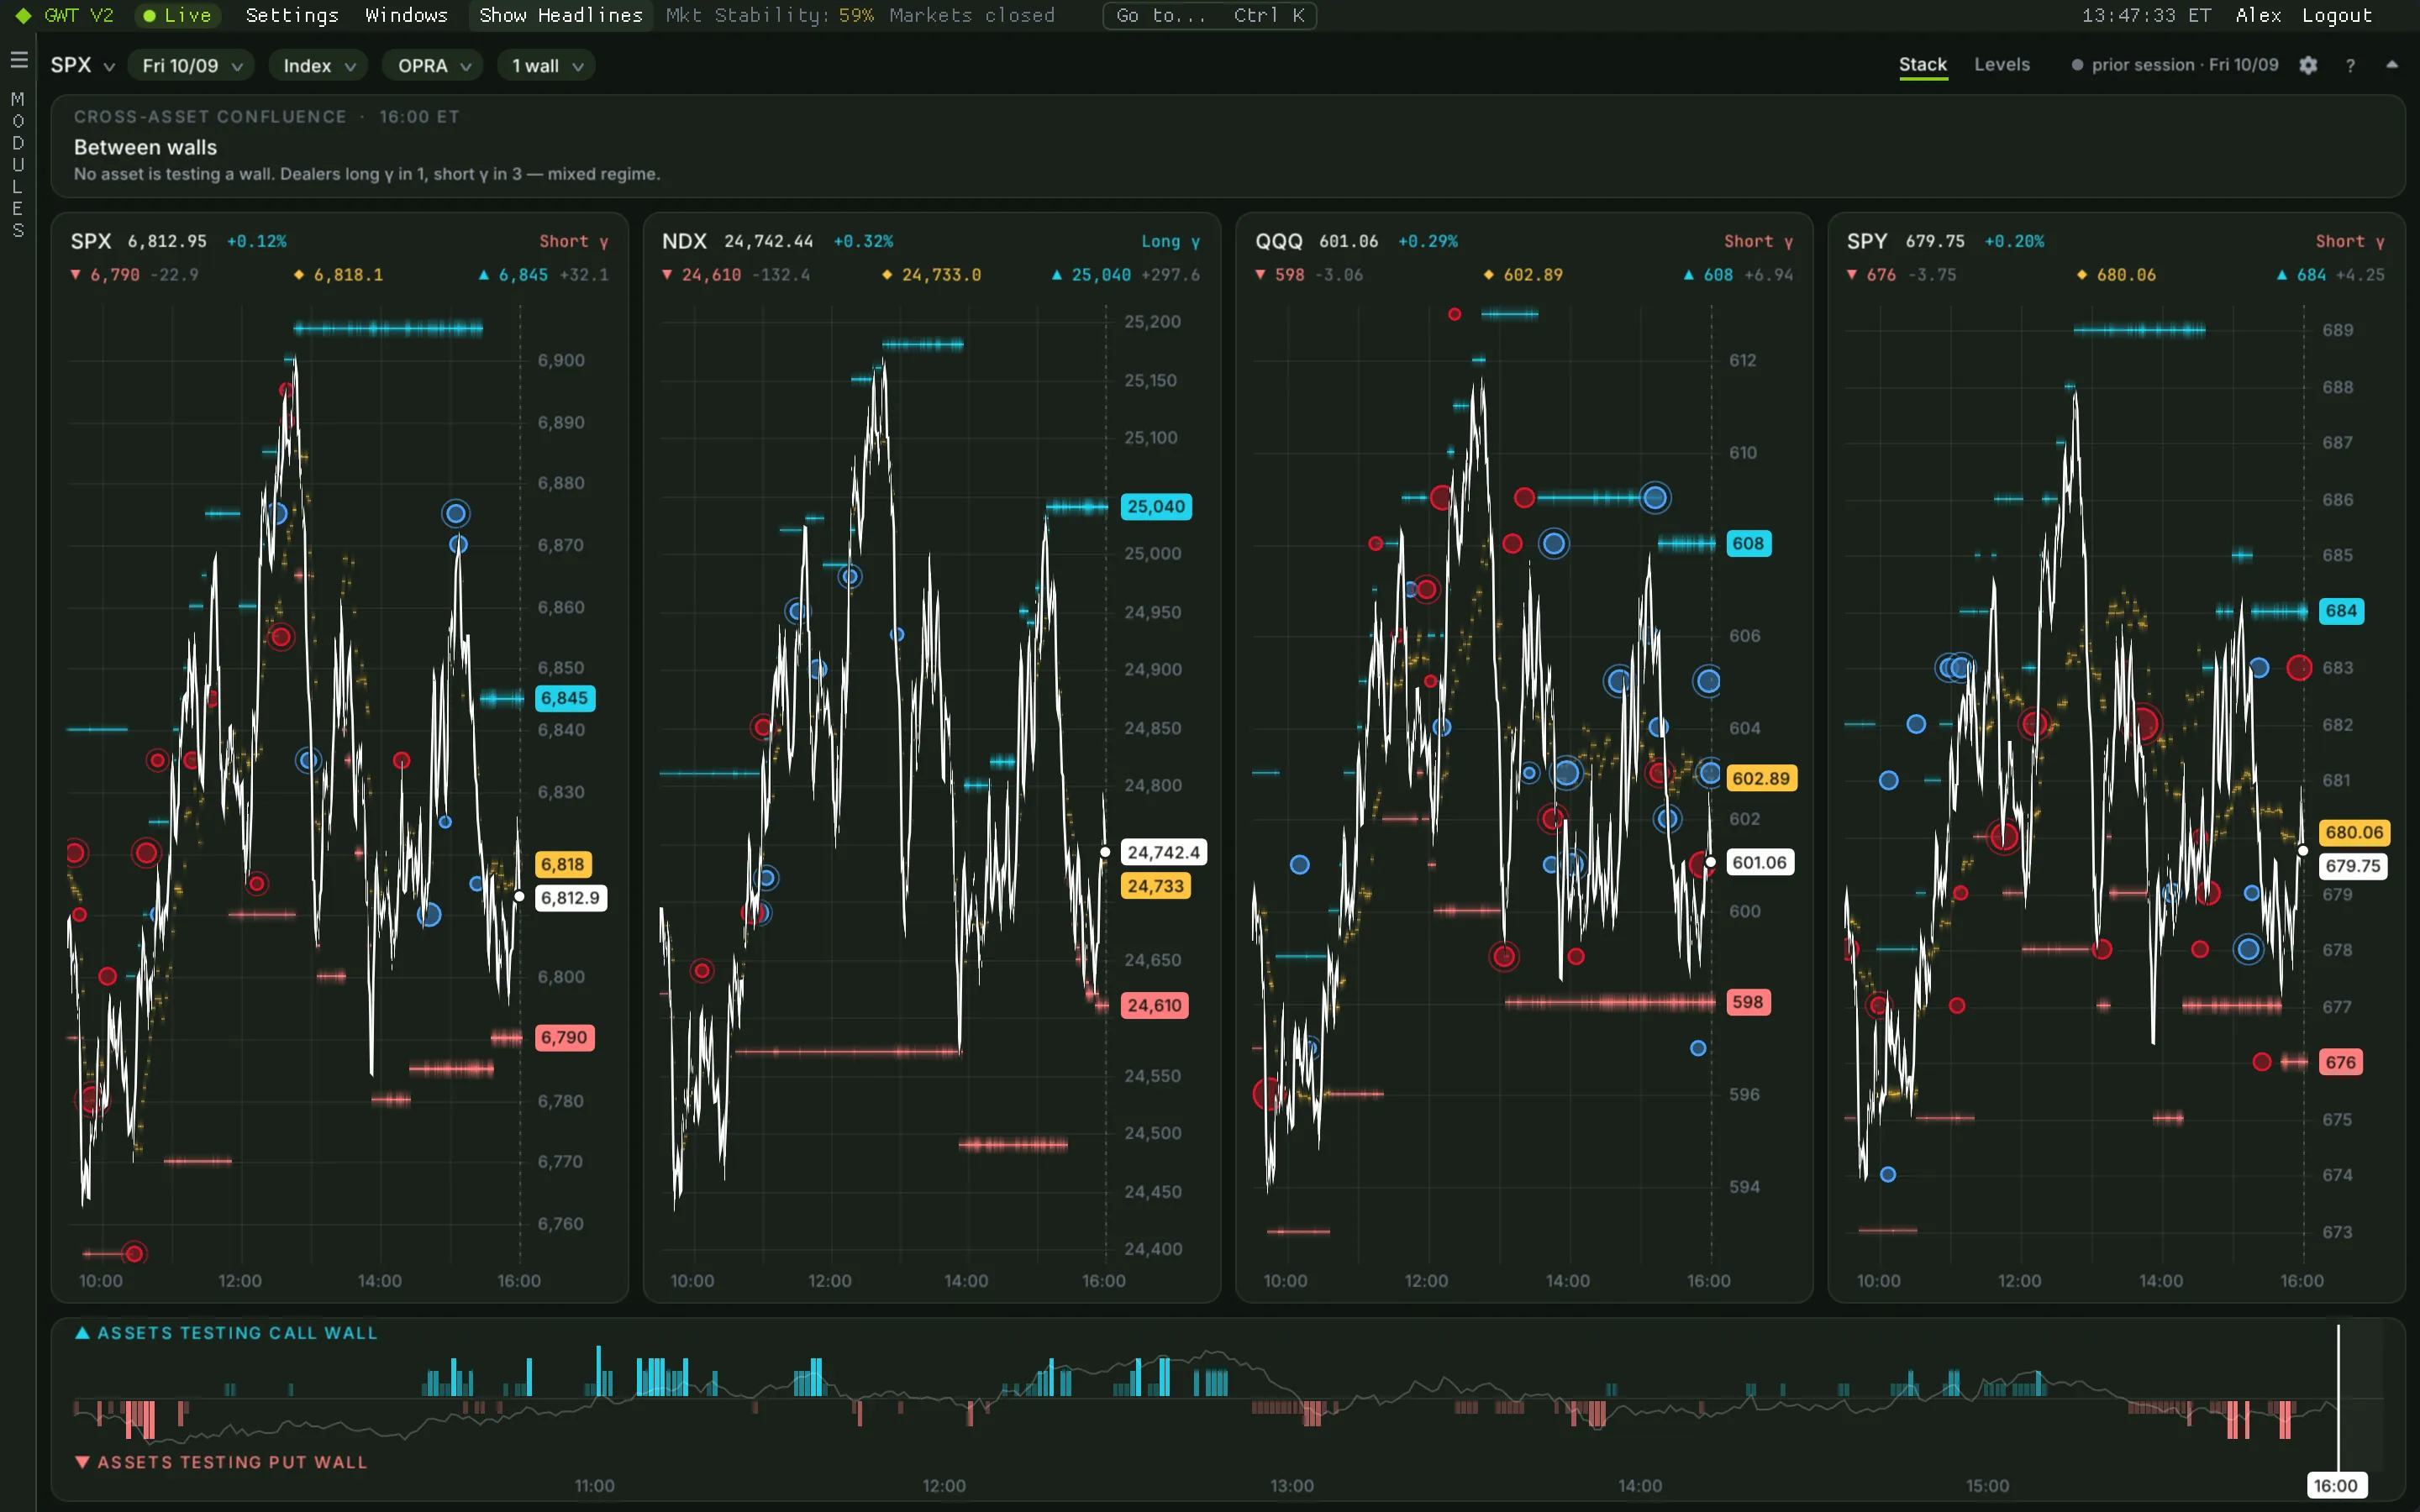
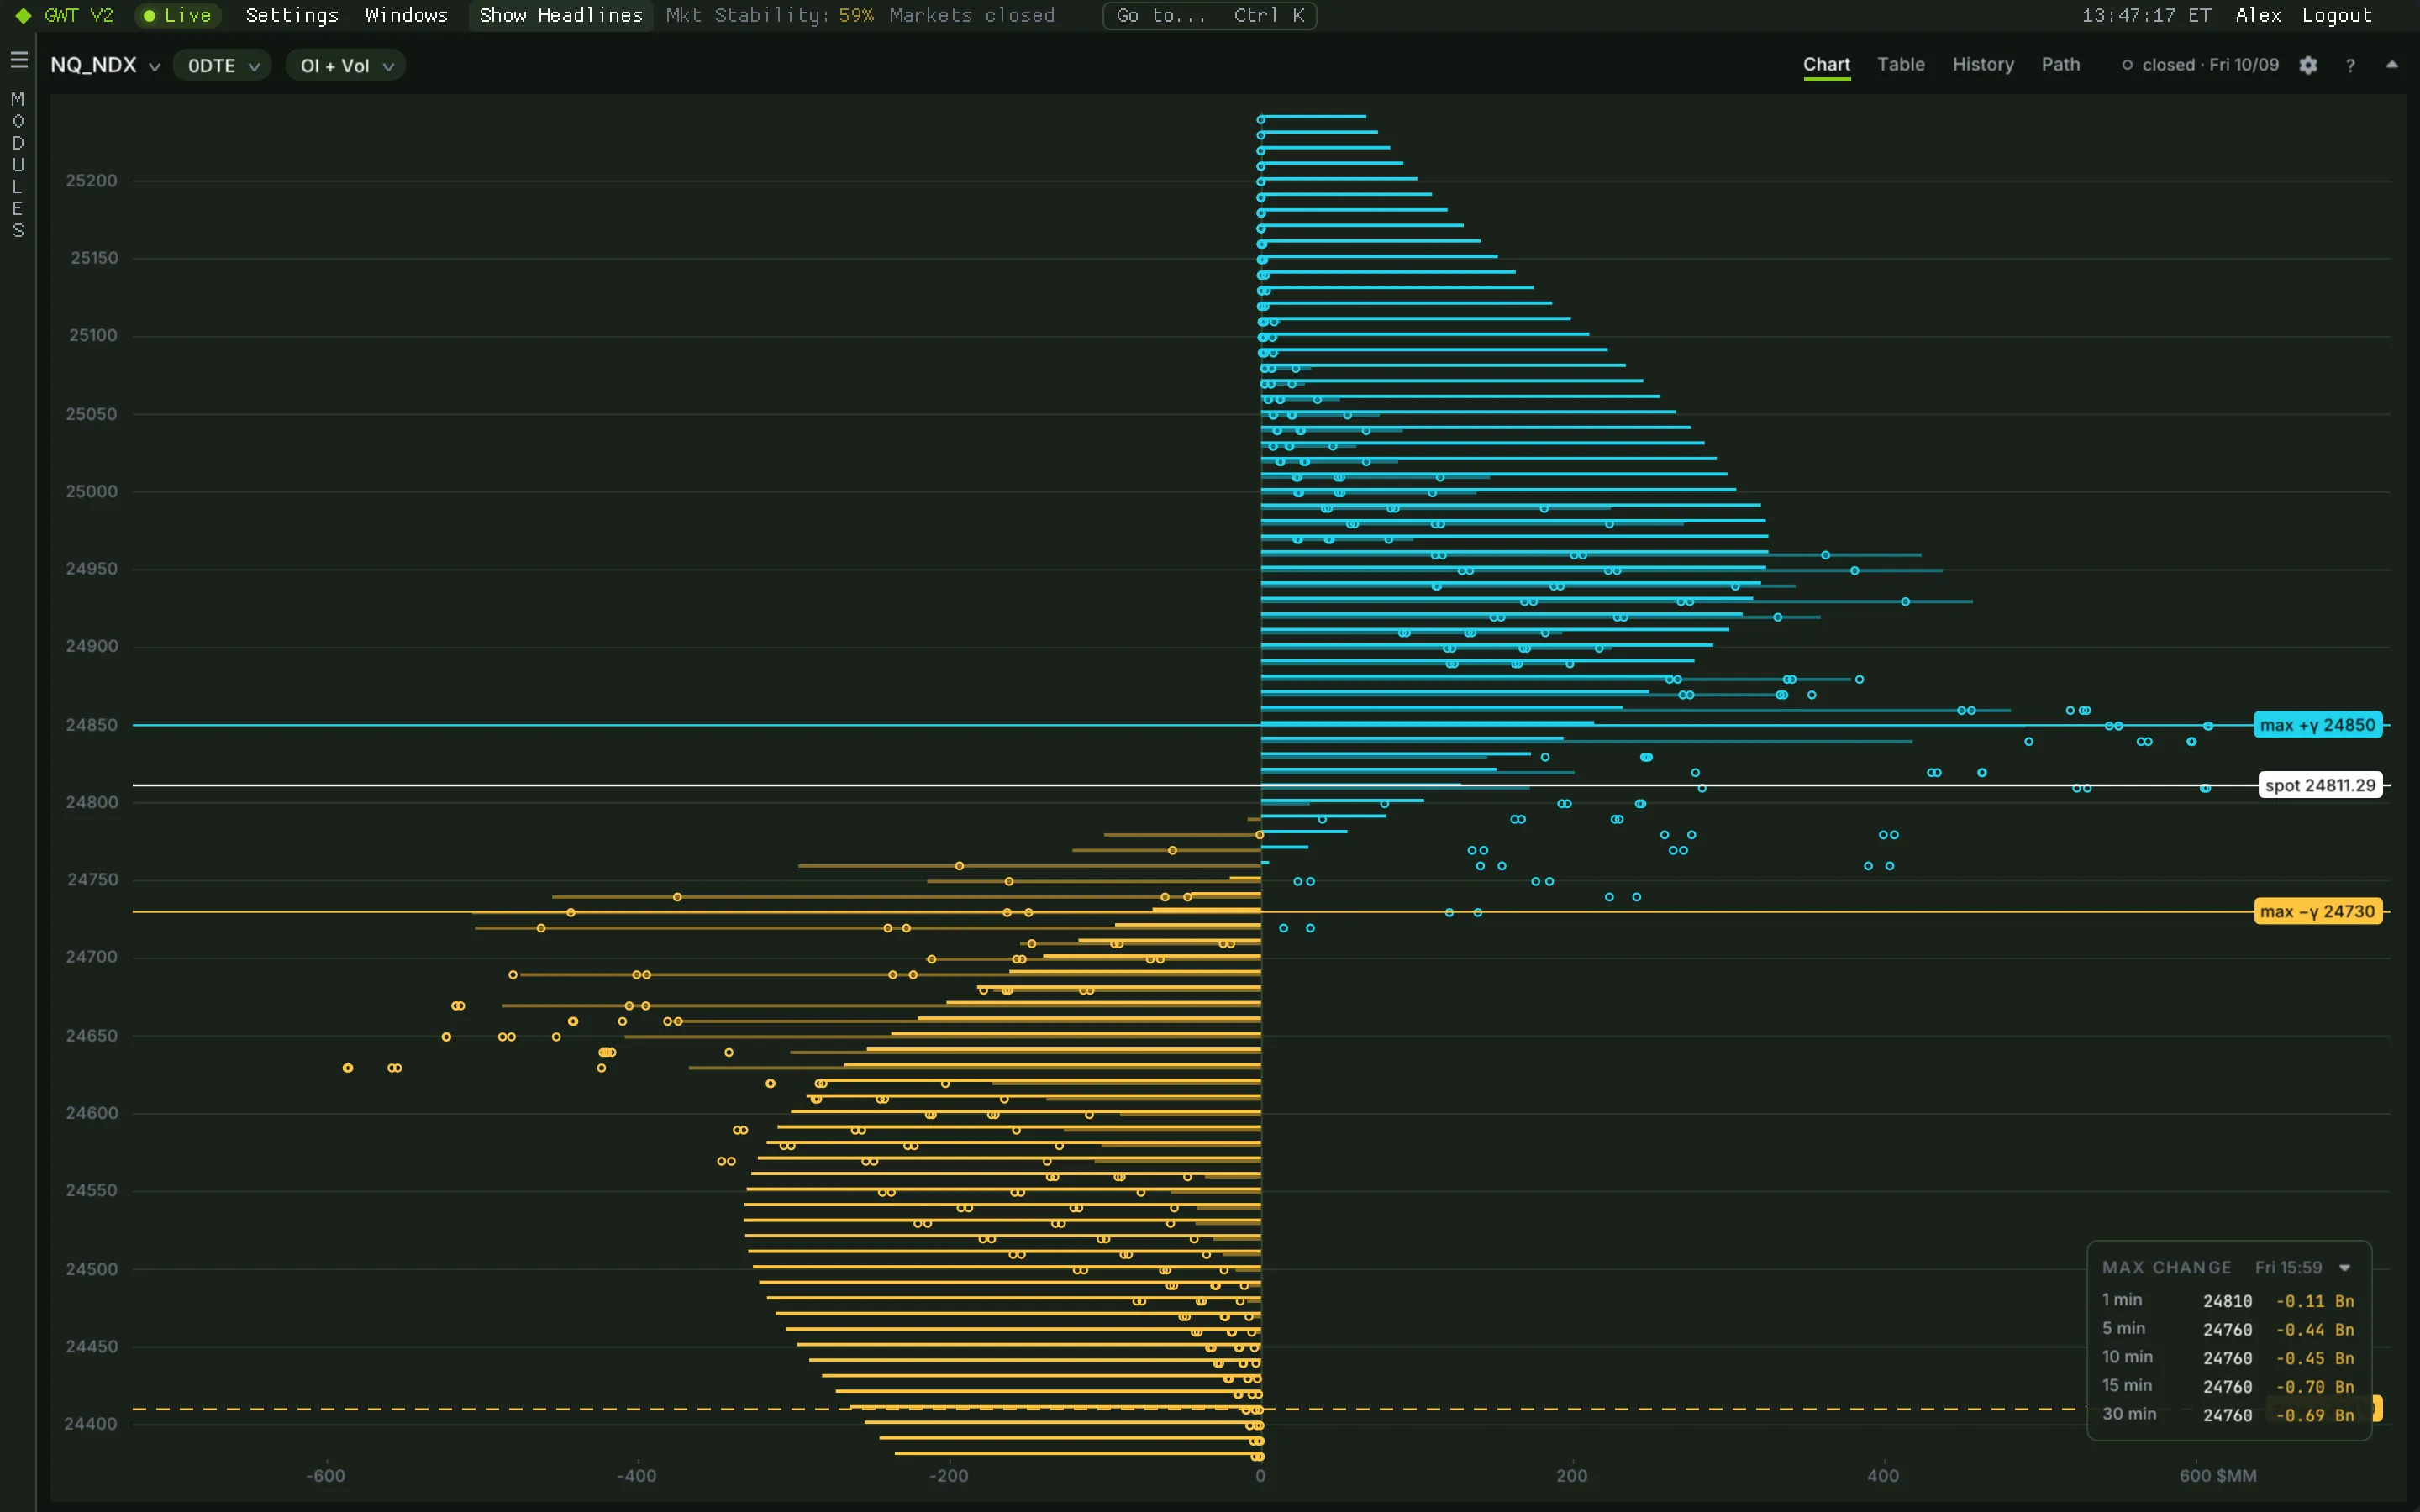
GEX Standard
Gamma exposure, strike by strike.
Each strike's dealer gamma exposure as two bars, open interest solid and today's volume as a tint. Positive gamma points right, negative left. Spot, zero gamma and the largest positive and negative strikes are drawn across the chart.
- ES/SPX, NQ/NDX, SPY and QQQ, for the 0DTE, next or 90-day expiries.
- Max change: the strike whose exposure moved most over the last 1, 5, 10, 15 and 30 minutes.
- History and Path tabs with a replay slider for the whole session.
- A sortable table with every strike's distance from spot and its named level.
How traders use itThe biggest bars are the walls price tends to react to. The max-change box tells you where positioning is shifting right now.
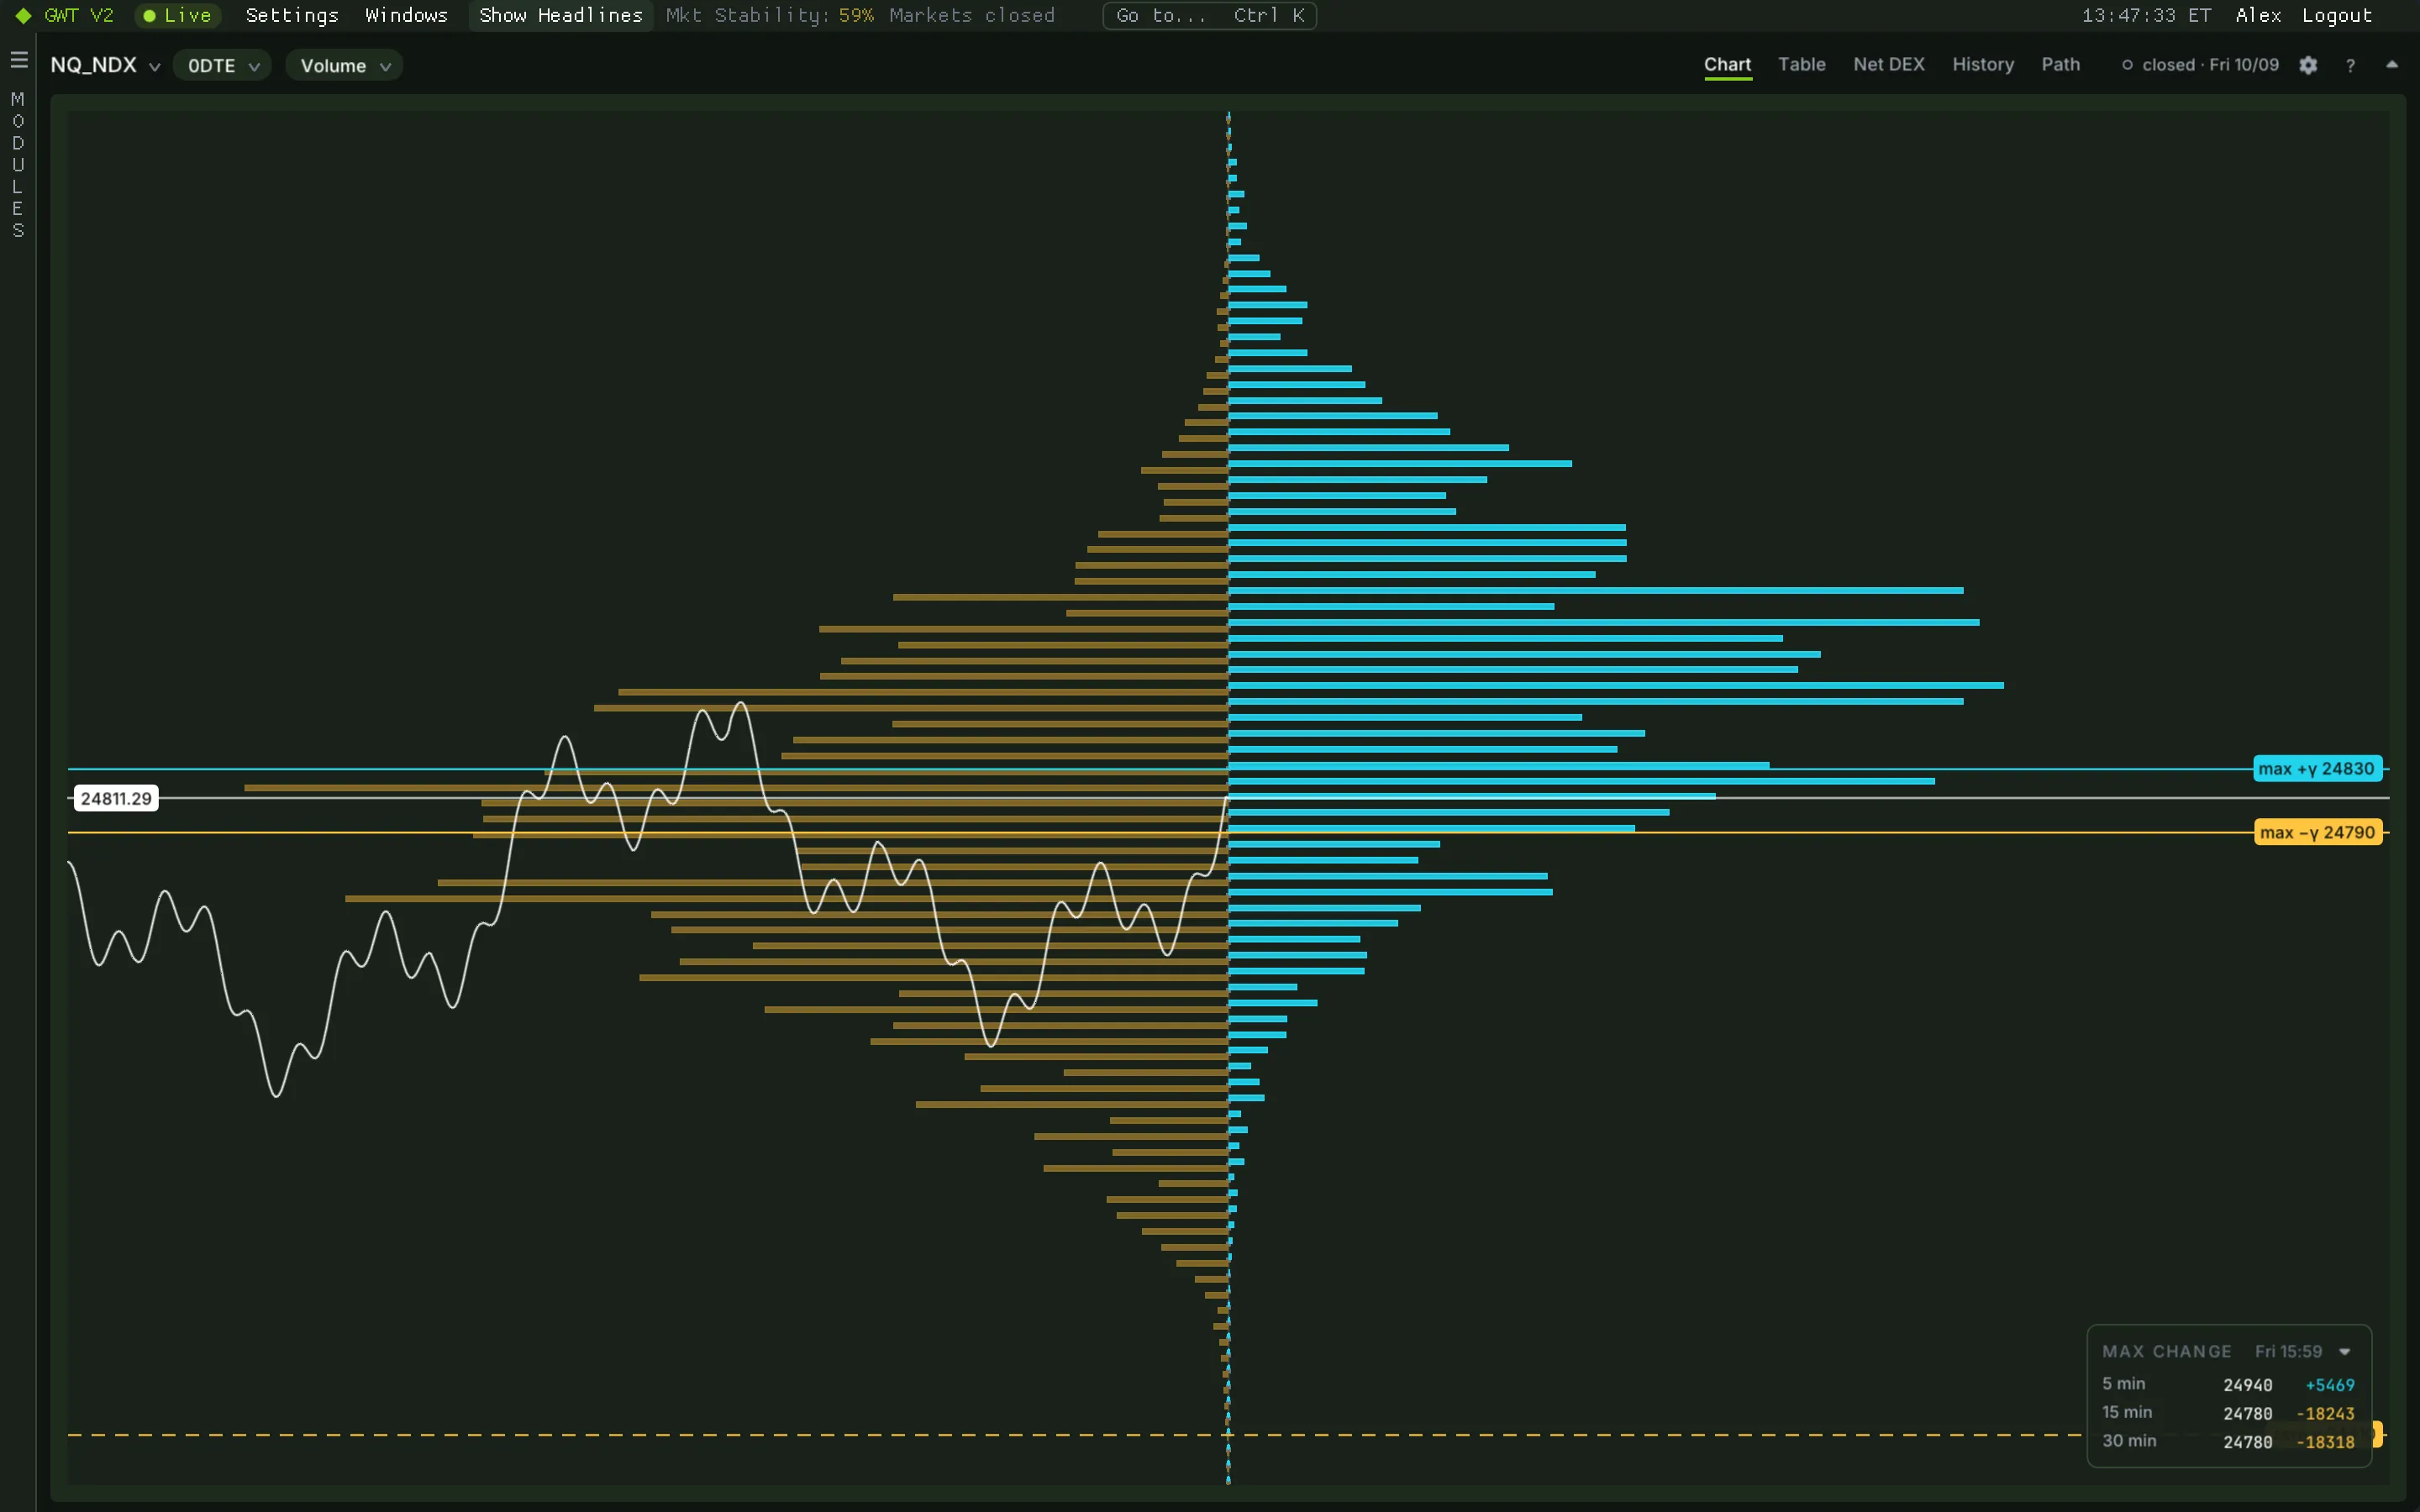
GEX Greeks
Volume, delta, gamma, vanna and charm by strike.
Dealer exposure for one symbol and expiry in the greek you choose. Each strike shows its calls just above and its puts just below, coloured by sign, with hollow dots for the same strike in earlier snapshots.
- Five metrics: Volume, Delta, Gamma, Vanna and Charm, plus a Net DEX view in dollars per one-point move.
- The volatility smile, and call and put implied volatility per strike in the table.
- Max change per window, spot's path through the session, and a replay slider.
- Landscape or profile layout, and keyboard shortcuts for every view.
How traders use itUse vanna and charm to see how hedging may shift as volatility moves and as time passes, not only as price moves.
IV Term Structure
What the options market is paying for, expiry by expiry.
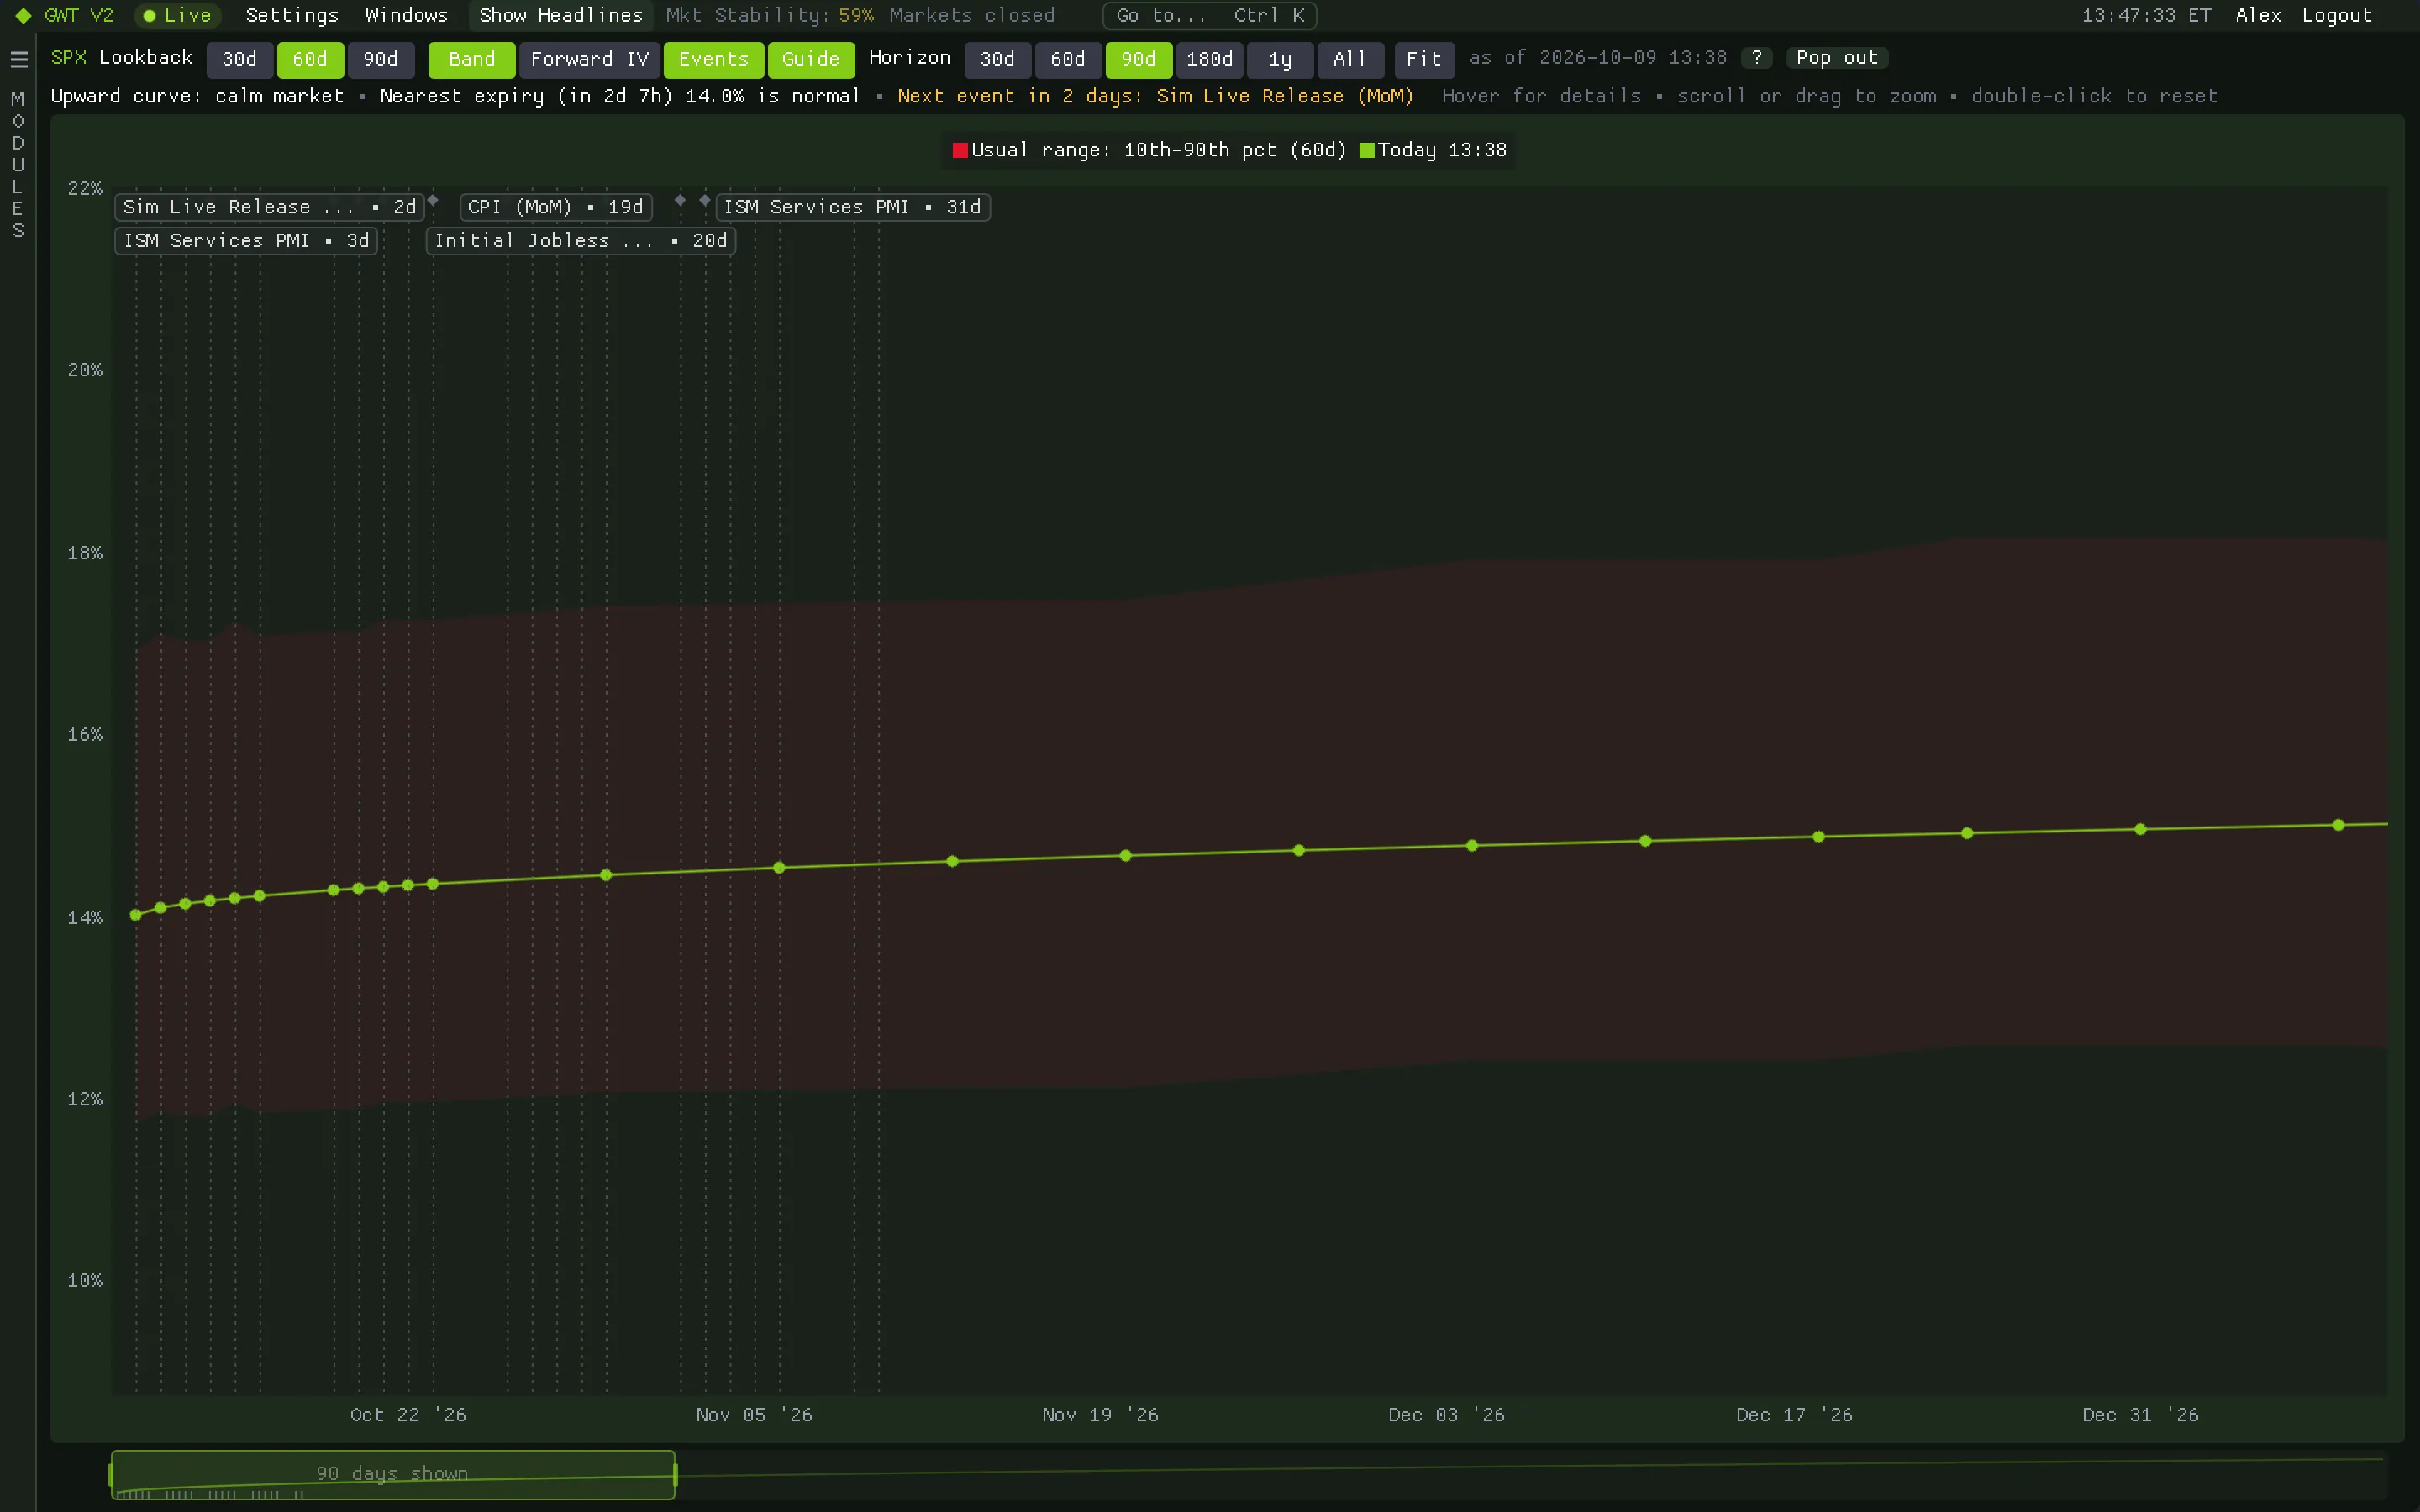
Each point is the at-the-money implied volatility of one SPX expiration, plotted against its usual 10th to 90th percentile range at that time to expiry. A point above the band is priced richer than 90% of recent sessions.
- A rising curve means later dates price more movement; an inverted one means the front is most expensive.
- Forward IV isolates what a single date adds on top of the curve, such as an event premium.
- Scheduled events marked on their expiries, with a 30, 60 or 90-day lookback for the band.
How traders use itA kink over one date usually means the market is paying for something scheduled there. Check it before you sell premium across it.
Replay
Rewind a session and see it as it looked live.
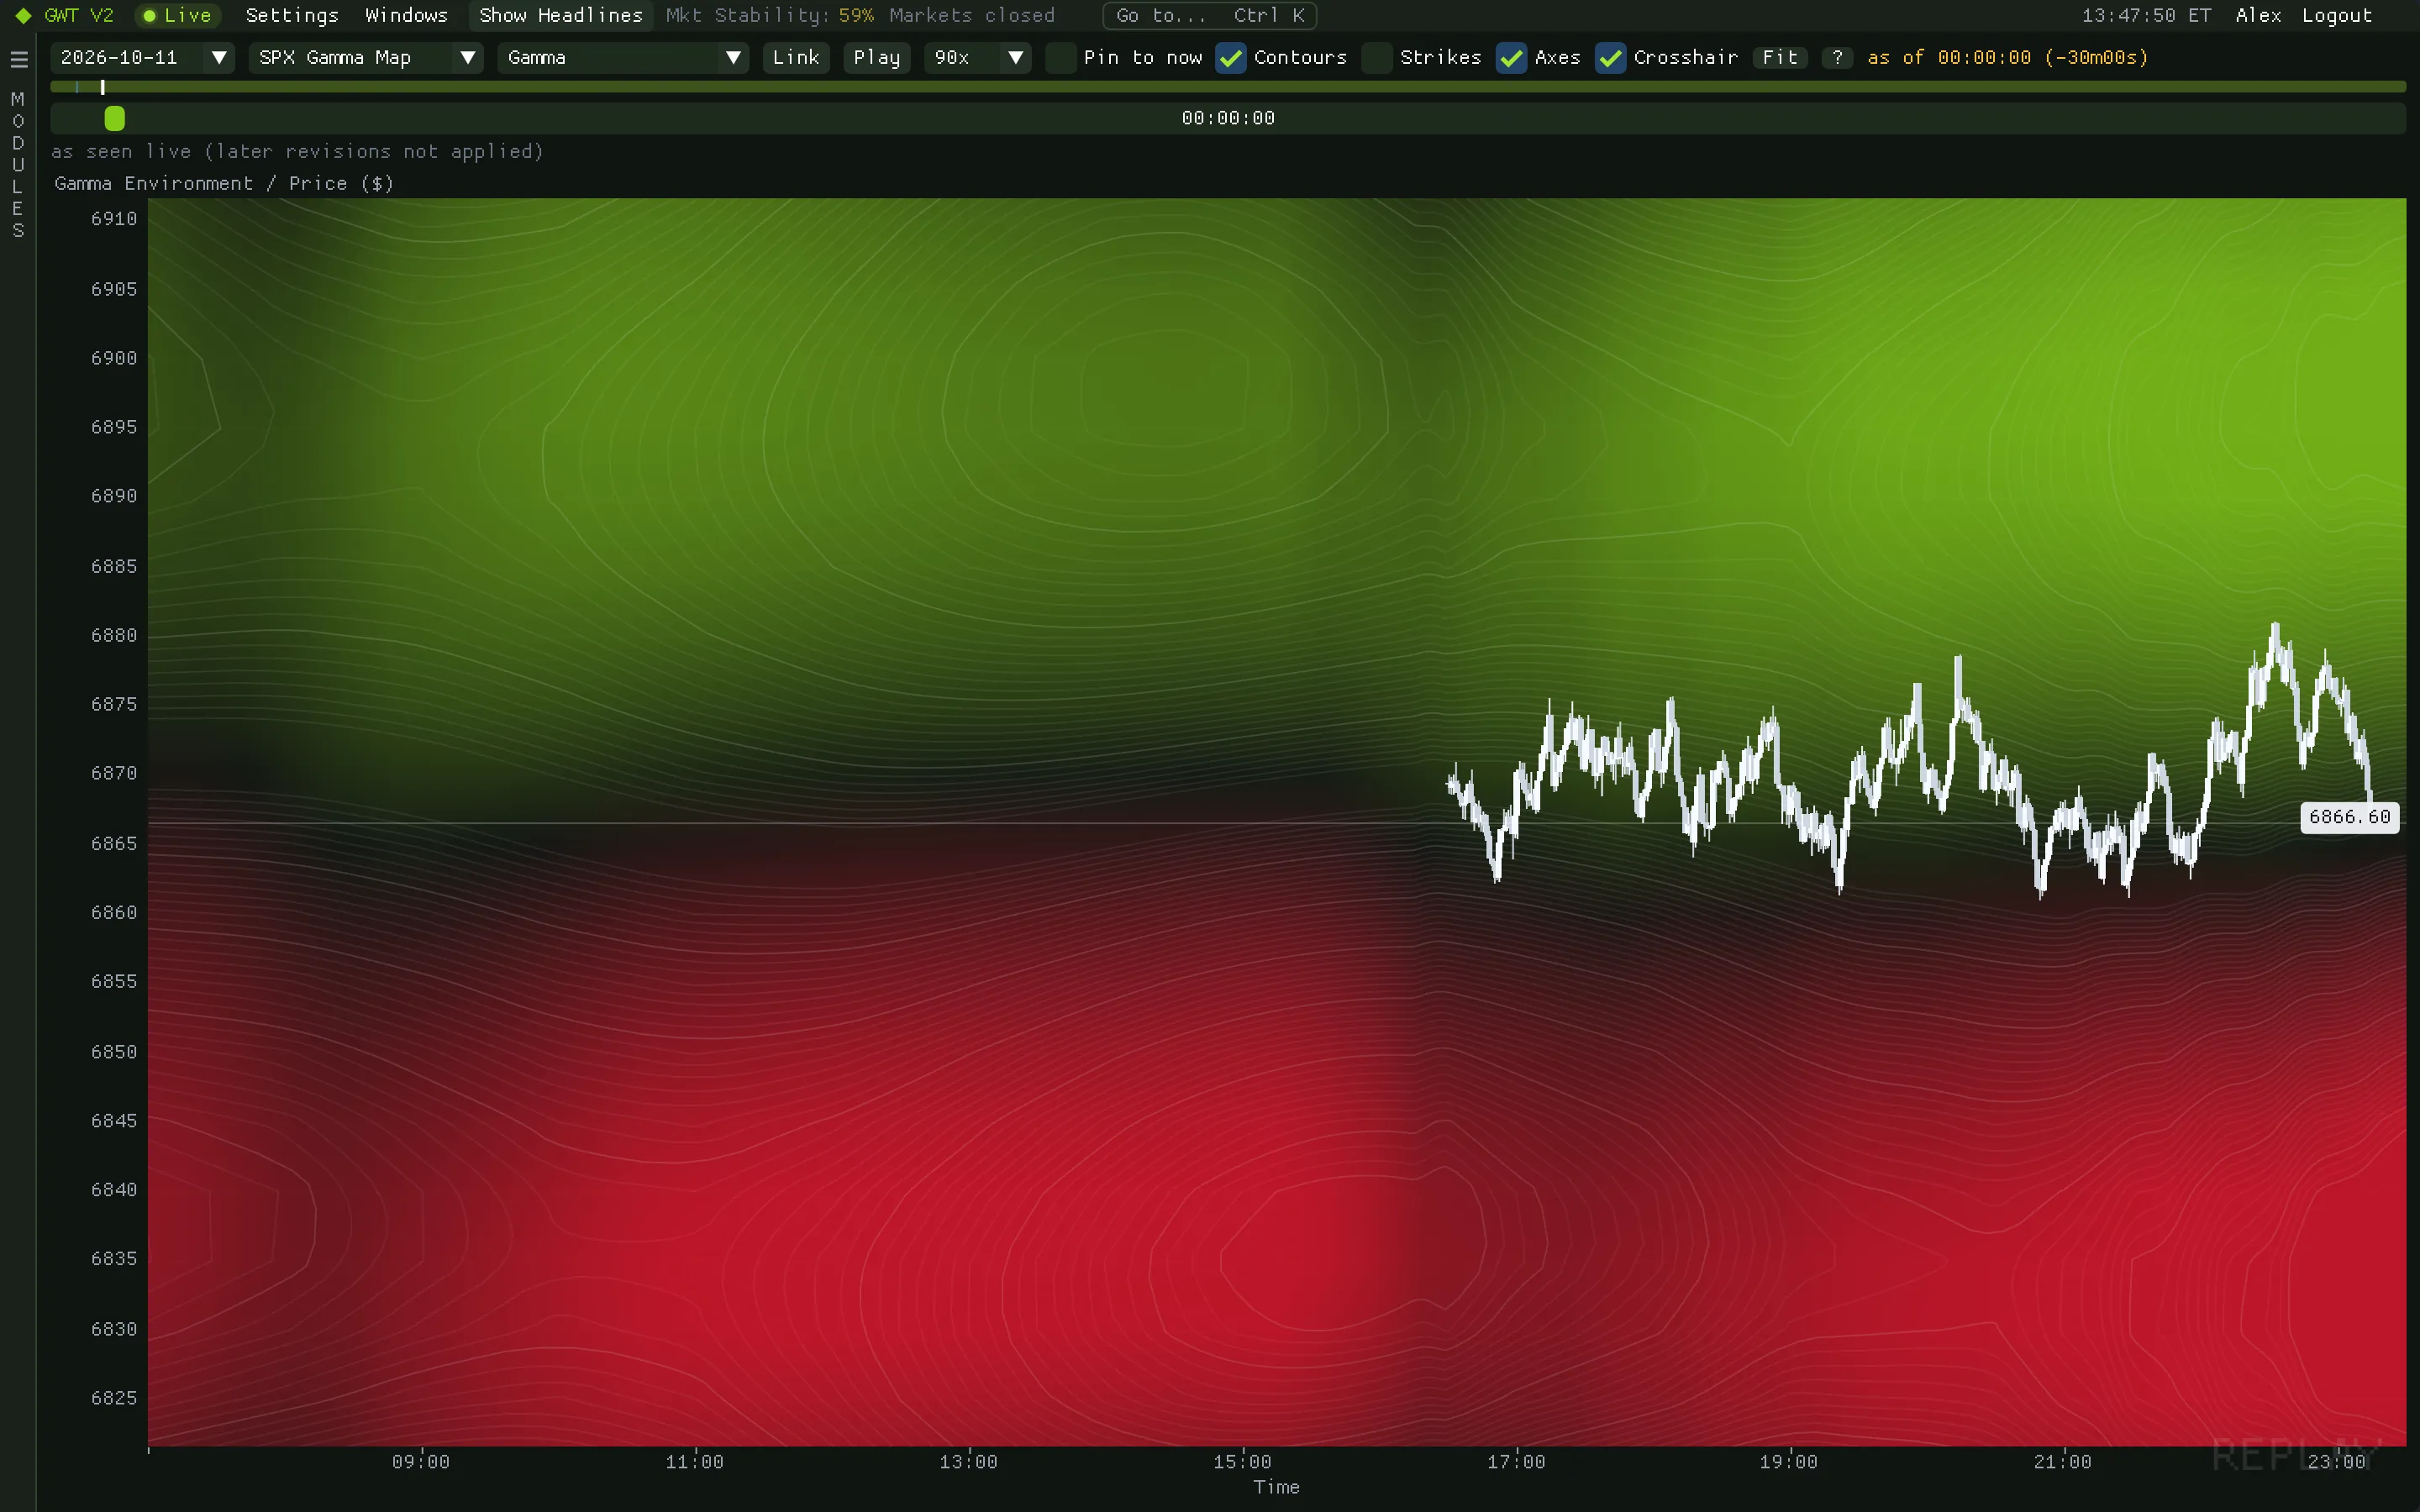
Replay plays back recorded intraday states of the SPX Gamma Map, GEX Standard and GEX Greeks: the same surfaces seen live, not a recalculation. The candle timeline is the clock; scrub it, or press play.
- Gamma, charm and delta surfaces, with the 0DTE strike bars as they stood at the playhead.
- 1x to 10x to practise the open in step with another platform's replay; faster speeds for review.
- A coverage bar that shows exactly where the recorder ran.
- Pin to now to follow today's recording live.
How traders use itStudy how the structure looked into a turn you missed, or practise a session open again with the gamma picture you would have had.
Keep exploring
Related modules
Ready when the open is
Put gamma, flow and liquidity on one screen.
Get your access token, download the app for your Mac or PC and paste the token at sign-in. It takes about two minutes.