Where the S&P is likely to slow, pin or run.
A same-day SPX surface with time across and price up the side. Each cell estimates how stable the market is around that price and time, from how dealers are positioned, while candles show what price actually did. Think of it as a structure map, not a signal.
Screenshots: GWT V2 1.0.3 on simulated market data.
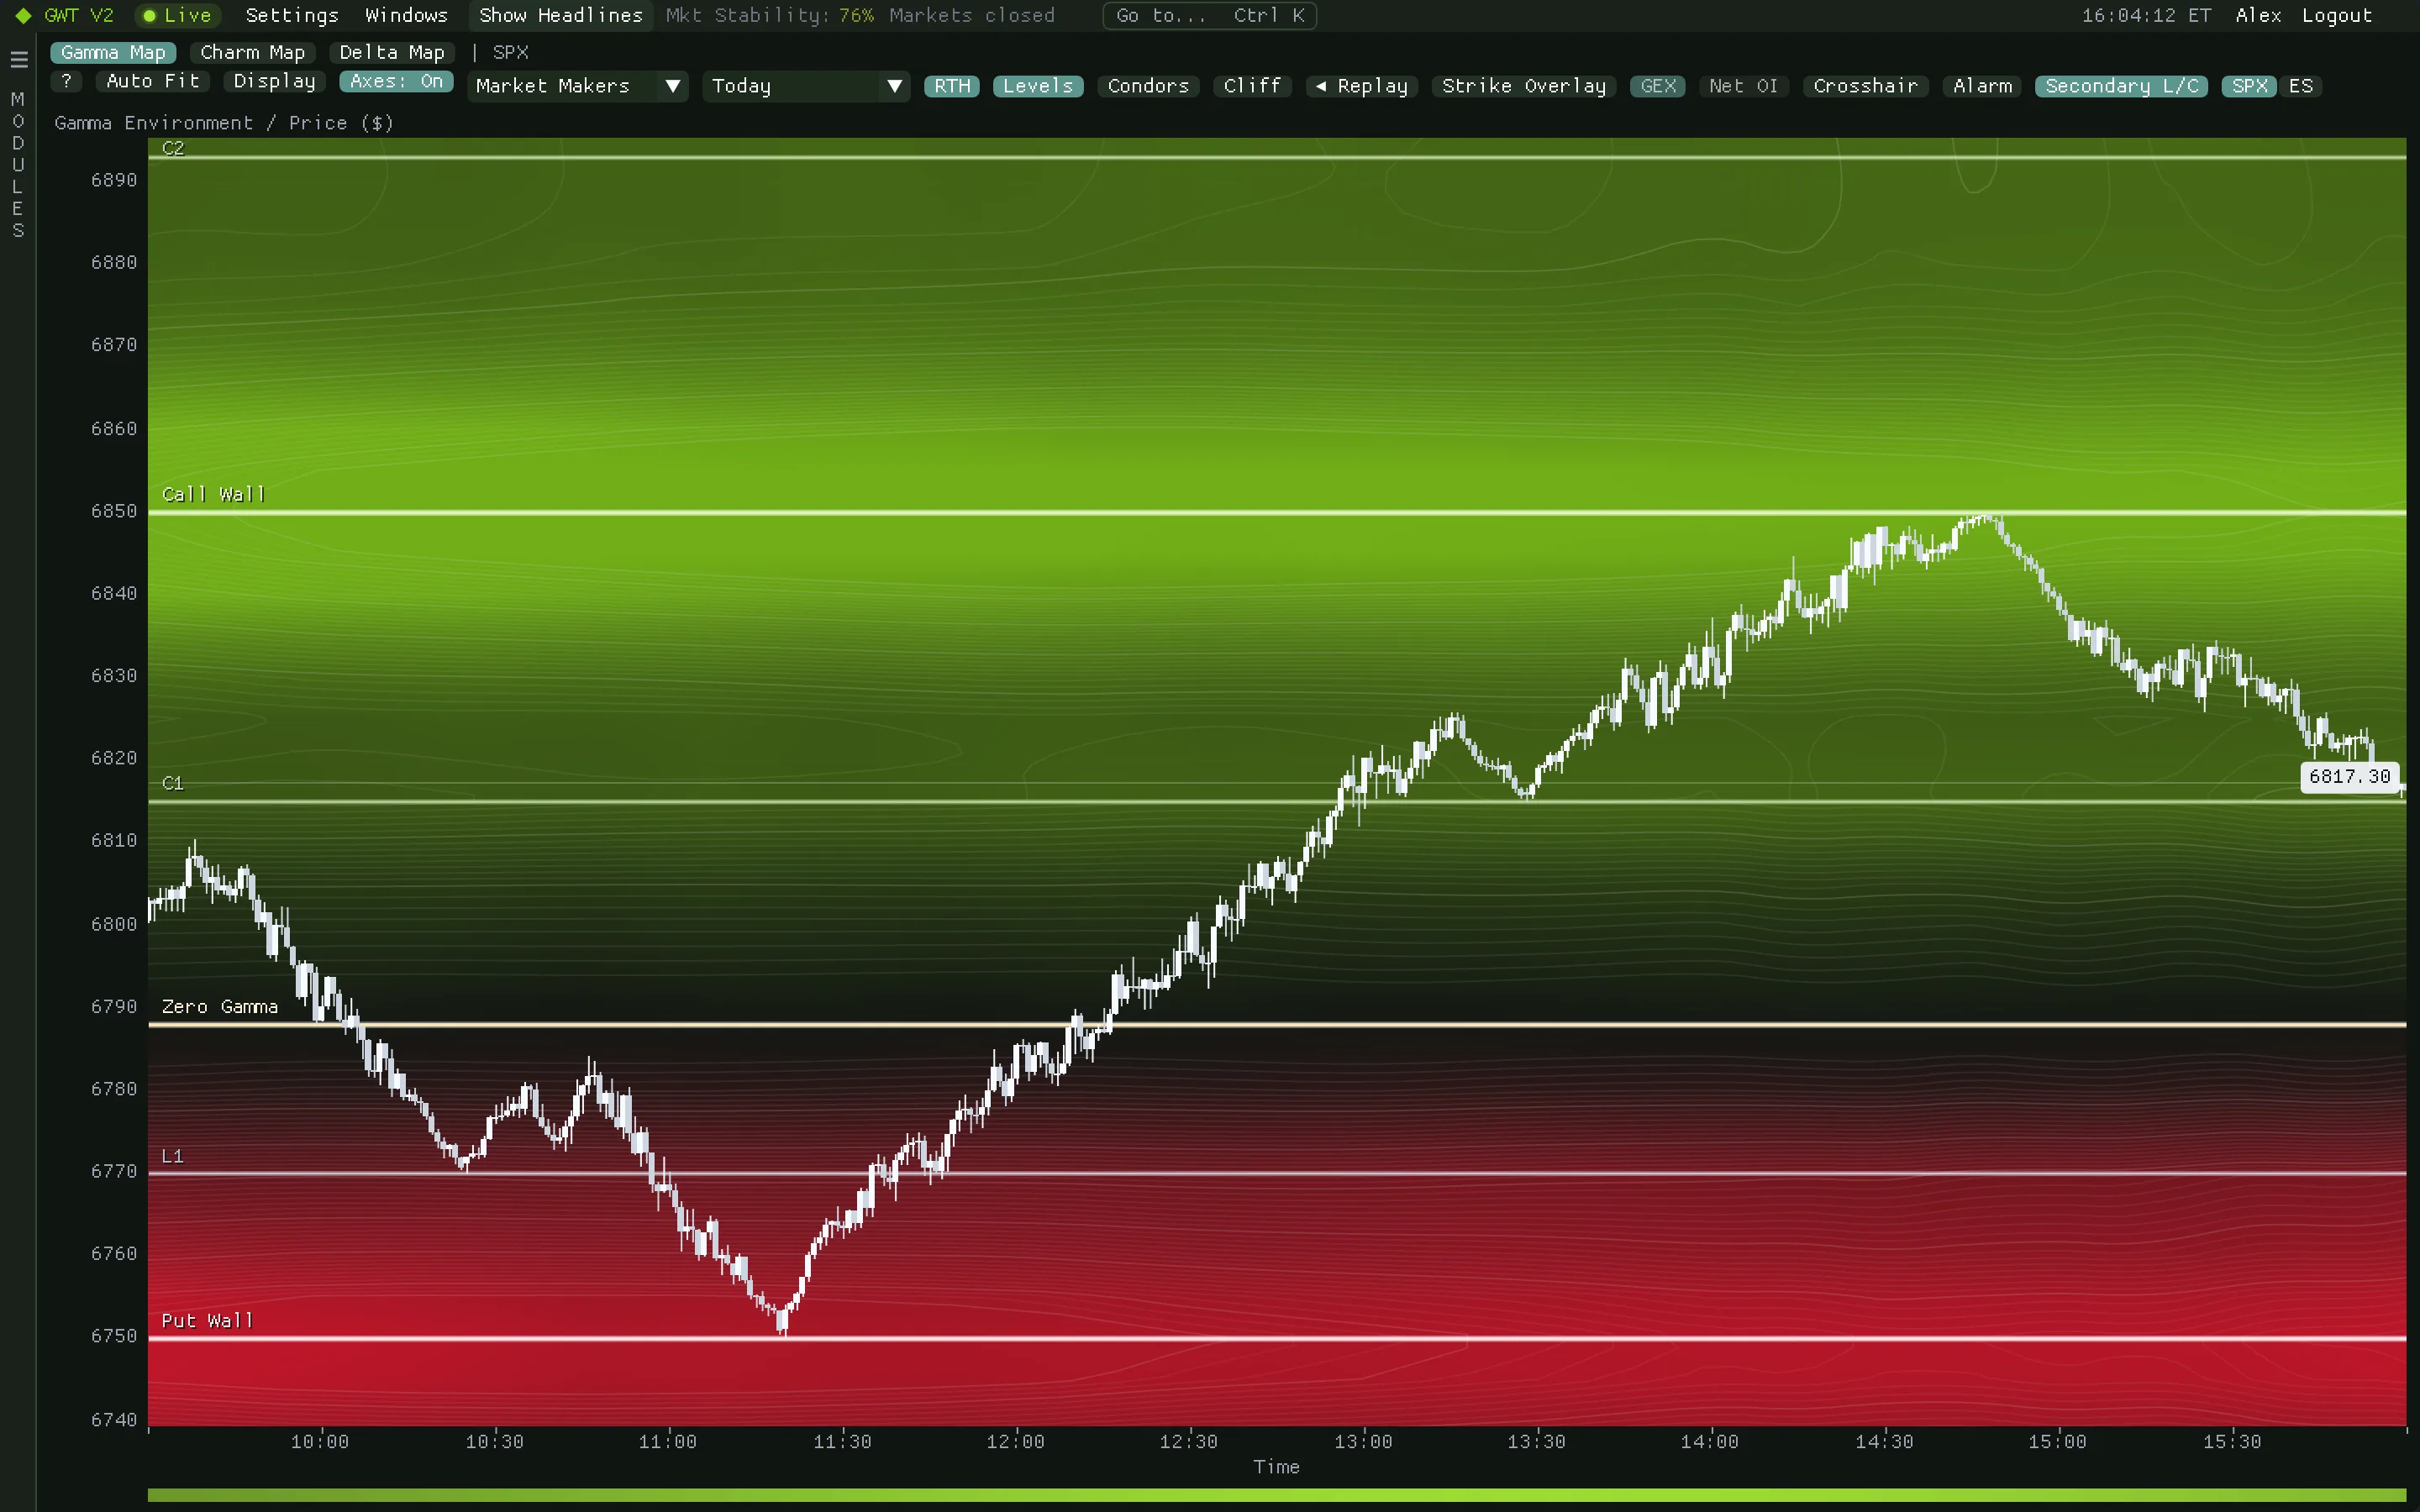
- 1L1 pause, 10:25
- 2Put Wall bounce, 11:20
- 3Back above Zero Gamma
- 4C1 retest, 13:28
- 5Call Wall rejection, 14:50
Anatomy of a session
How the levels framed one day, step by step.
A scripted session, picked because every level gets tested in textbook order. Real days are rarely this tidy; the point is to show what each line means and how traders read price around it.
- 10:25 · L1 6770
A pause at L1
L1 is a secondary level below zero gamma, a smaller concentration of dealer gamma. Price tags it and bounces about ten points: a first sign the levels are being respected, not a reversal by itself.
- 11:20 · Put Wall 6750
The Put Wall holds
The Put Wall is the strike with the most negative dealer gamma, the deepest red on the map. Below zero gamma, hedging tends to amplify moves, so selling can accelerate into it and walls can break. Traders watch for stalling and rejection there rather than assume a bounce.
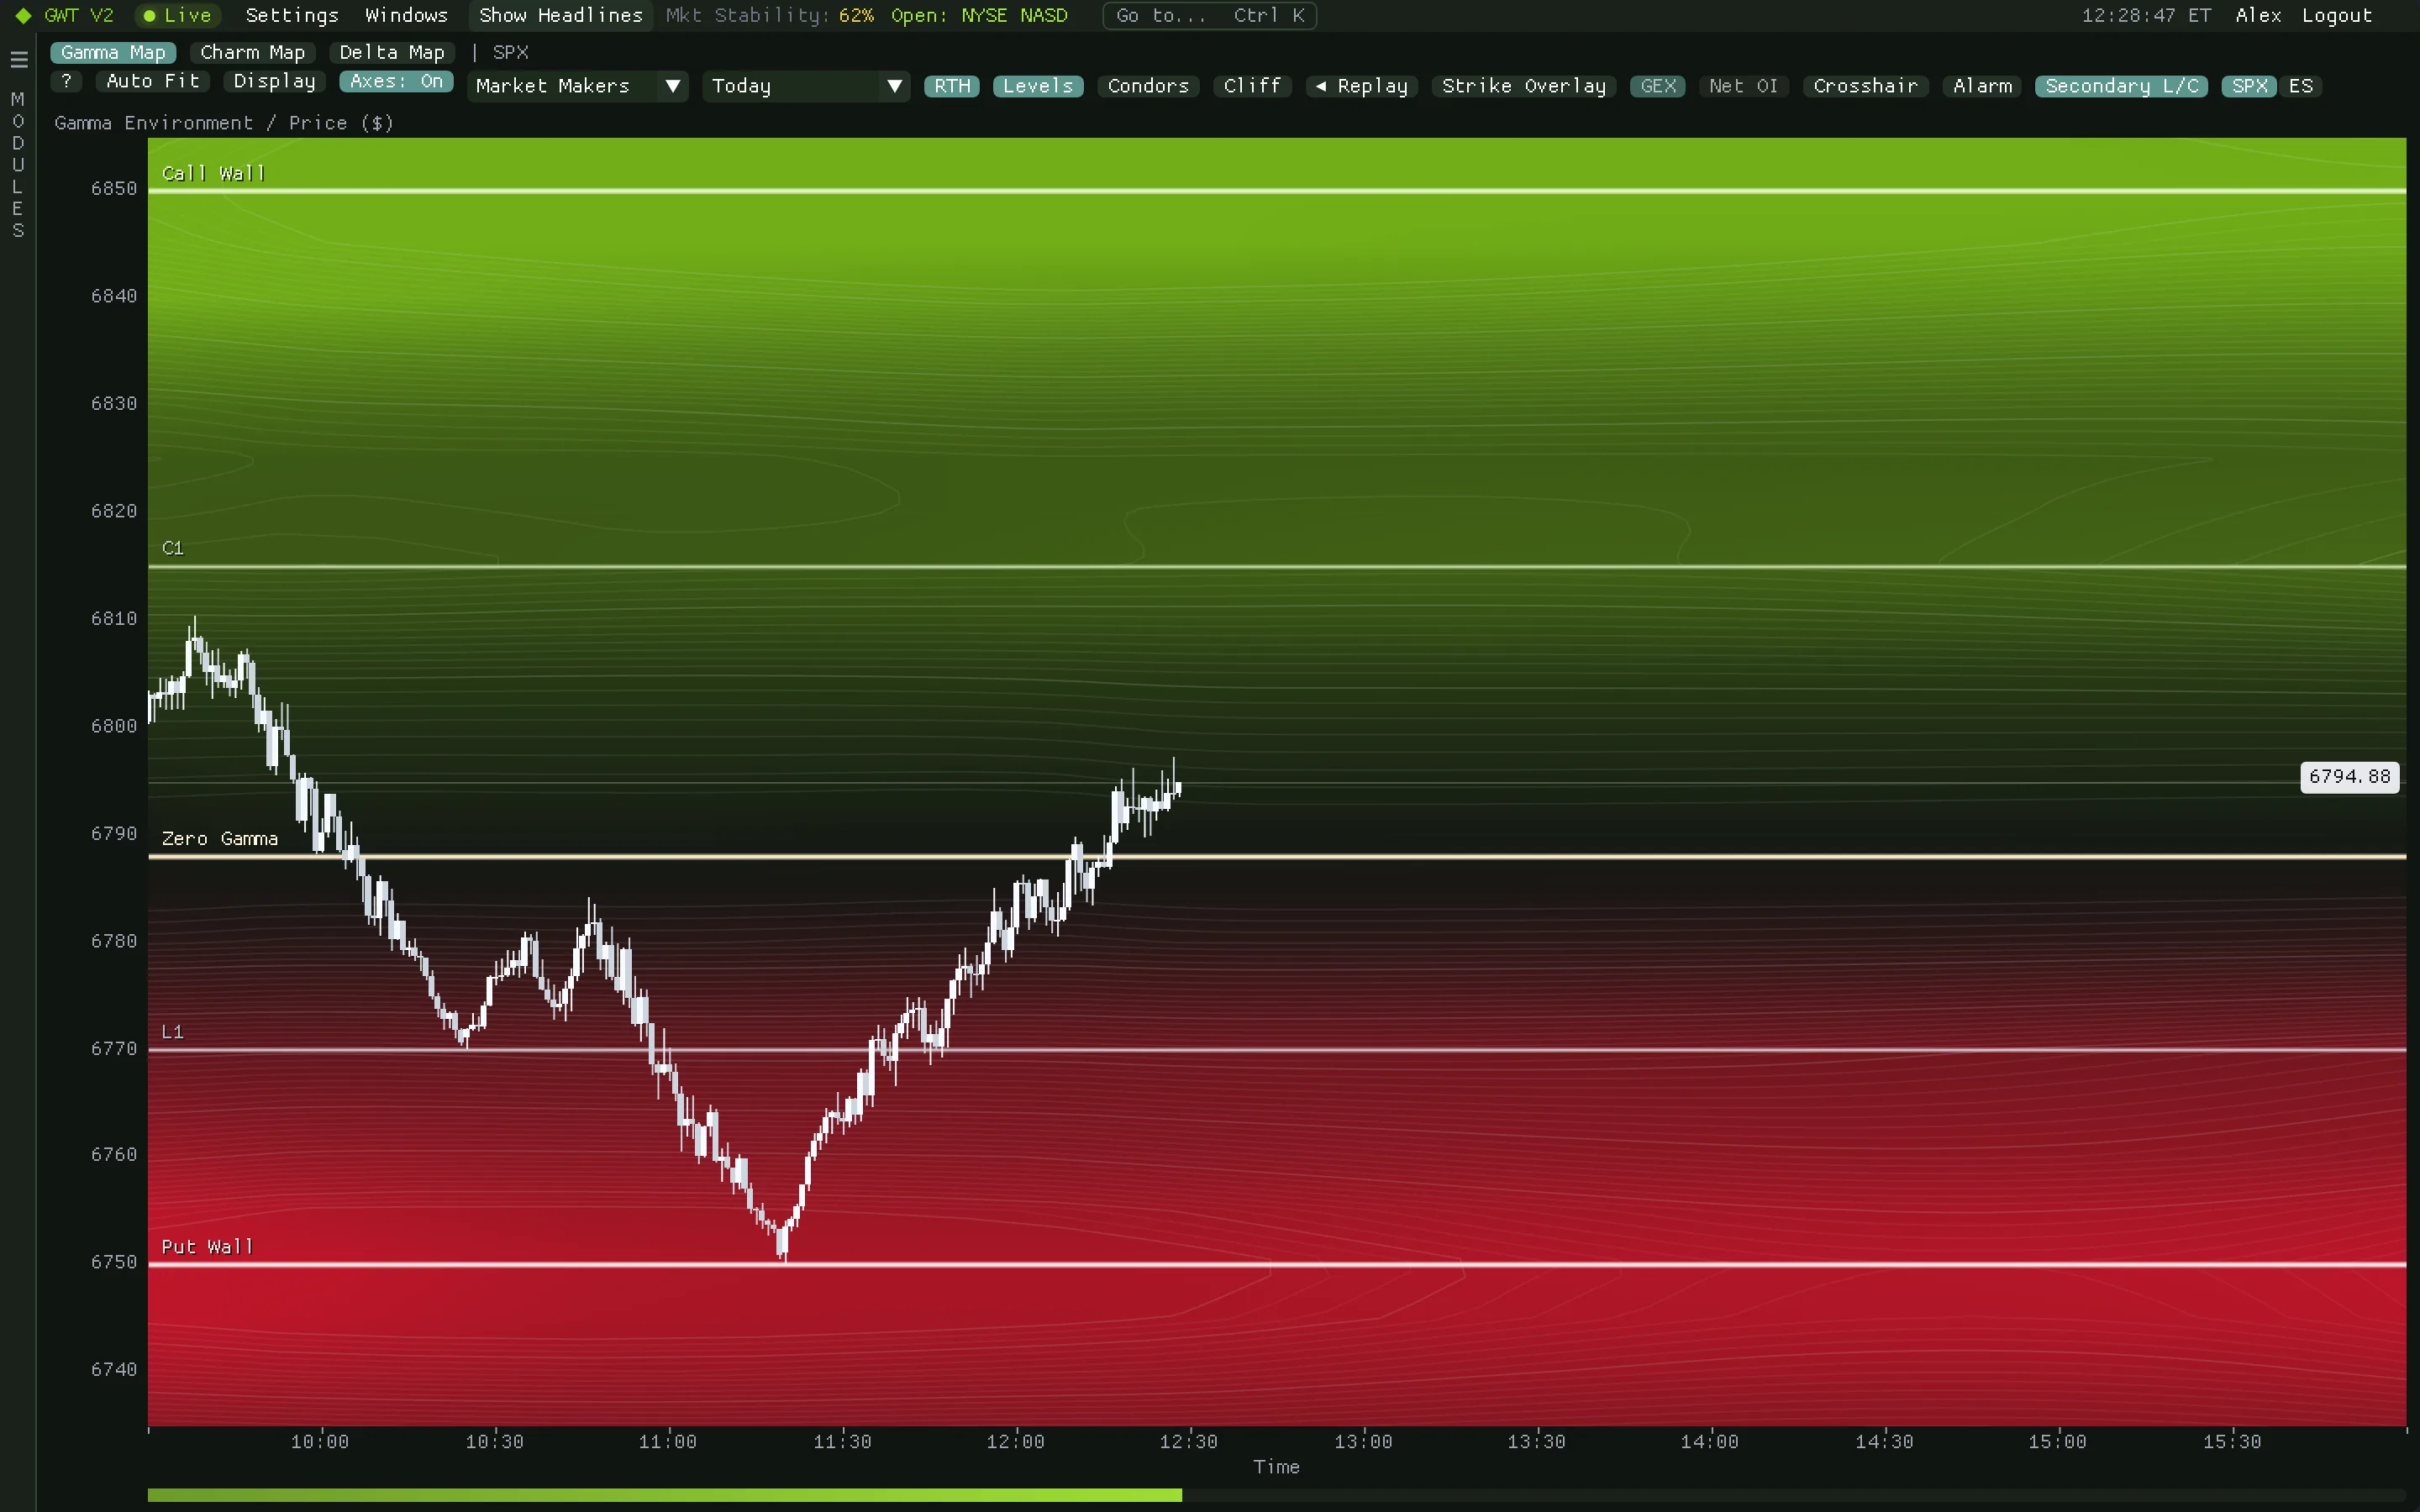
- 12:15 · Zero Gamma 6788
Back above zero gamma
Zero gamma is where the surface flips from red to green. Above it, hedging tends to damp moves, so pullbacks often get shallower and ranges tighter.
- 13:28 · C1 6815
C1 retested from above
C1 is a secondary level above zero gamma. A pullback that holds an old level from above is the classic test traders look for before leaning on it.
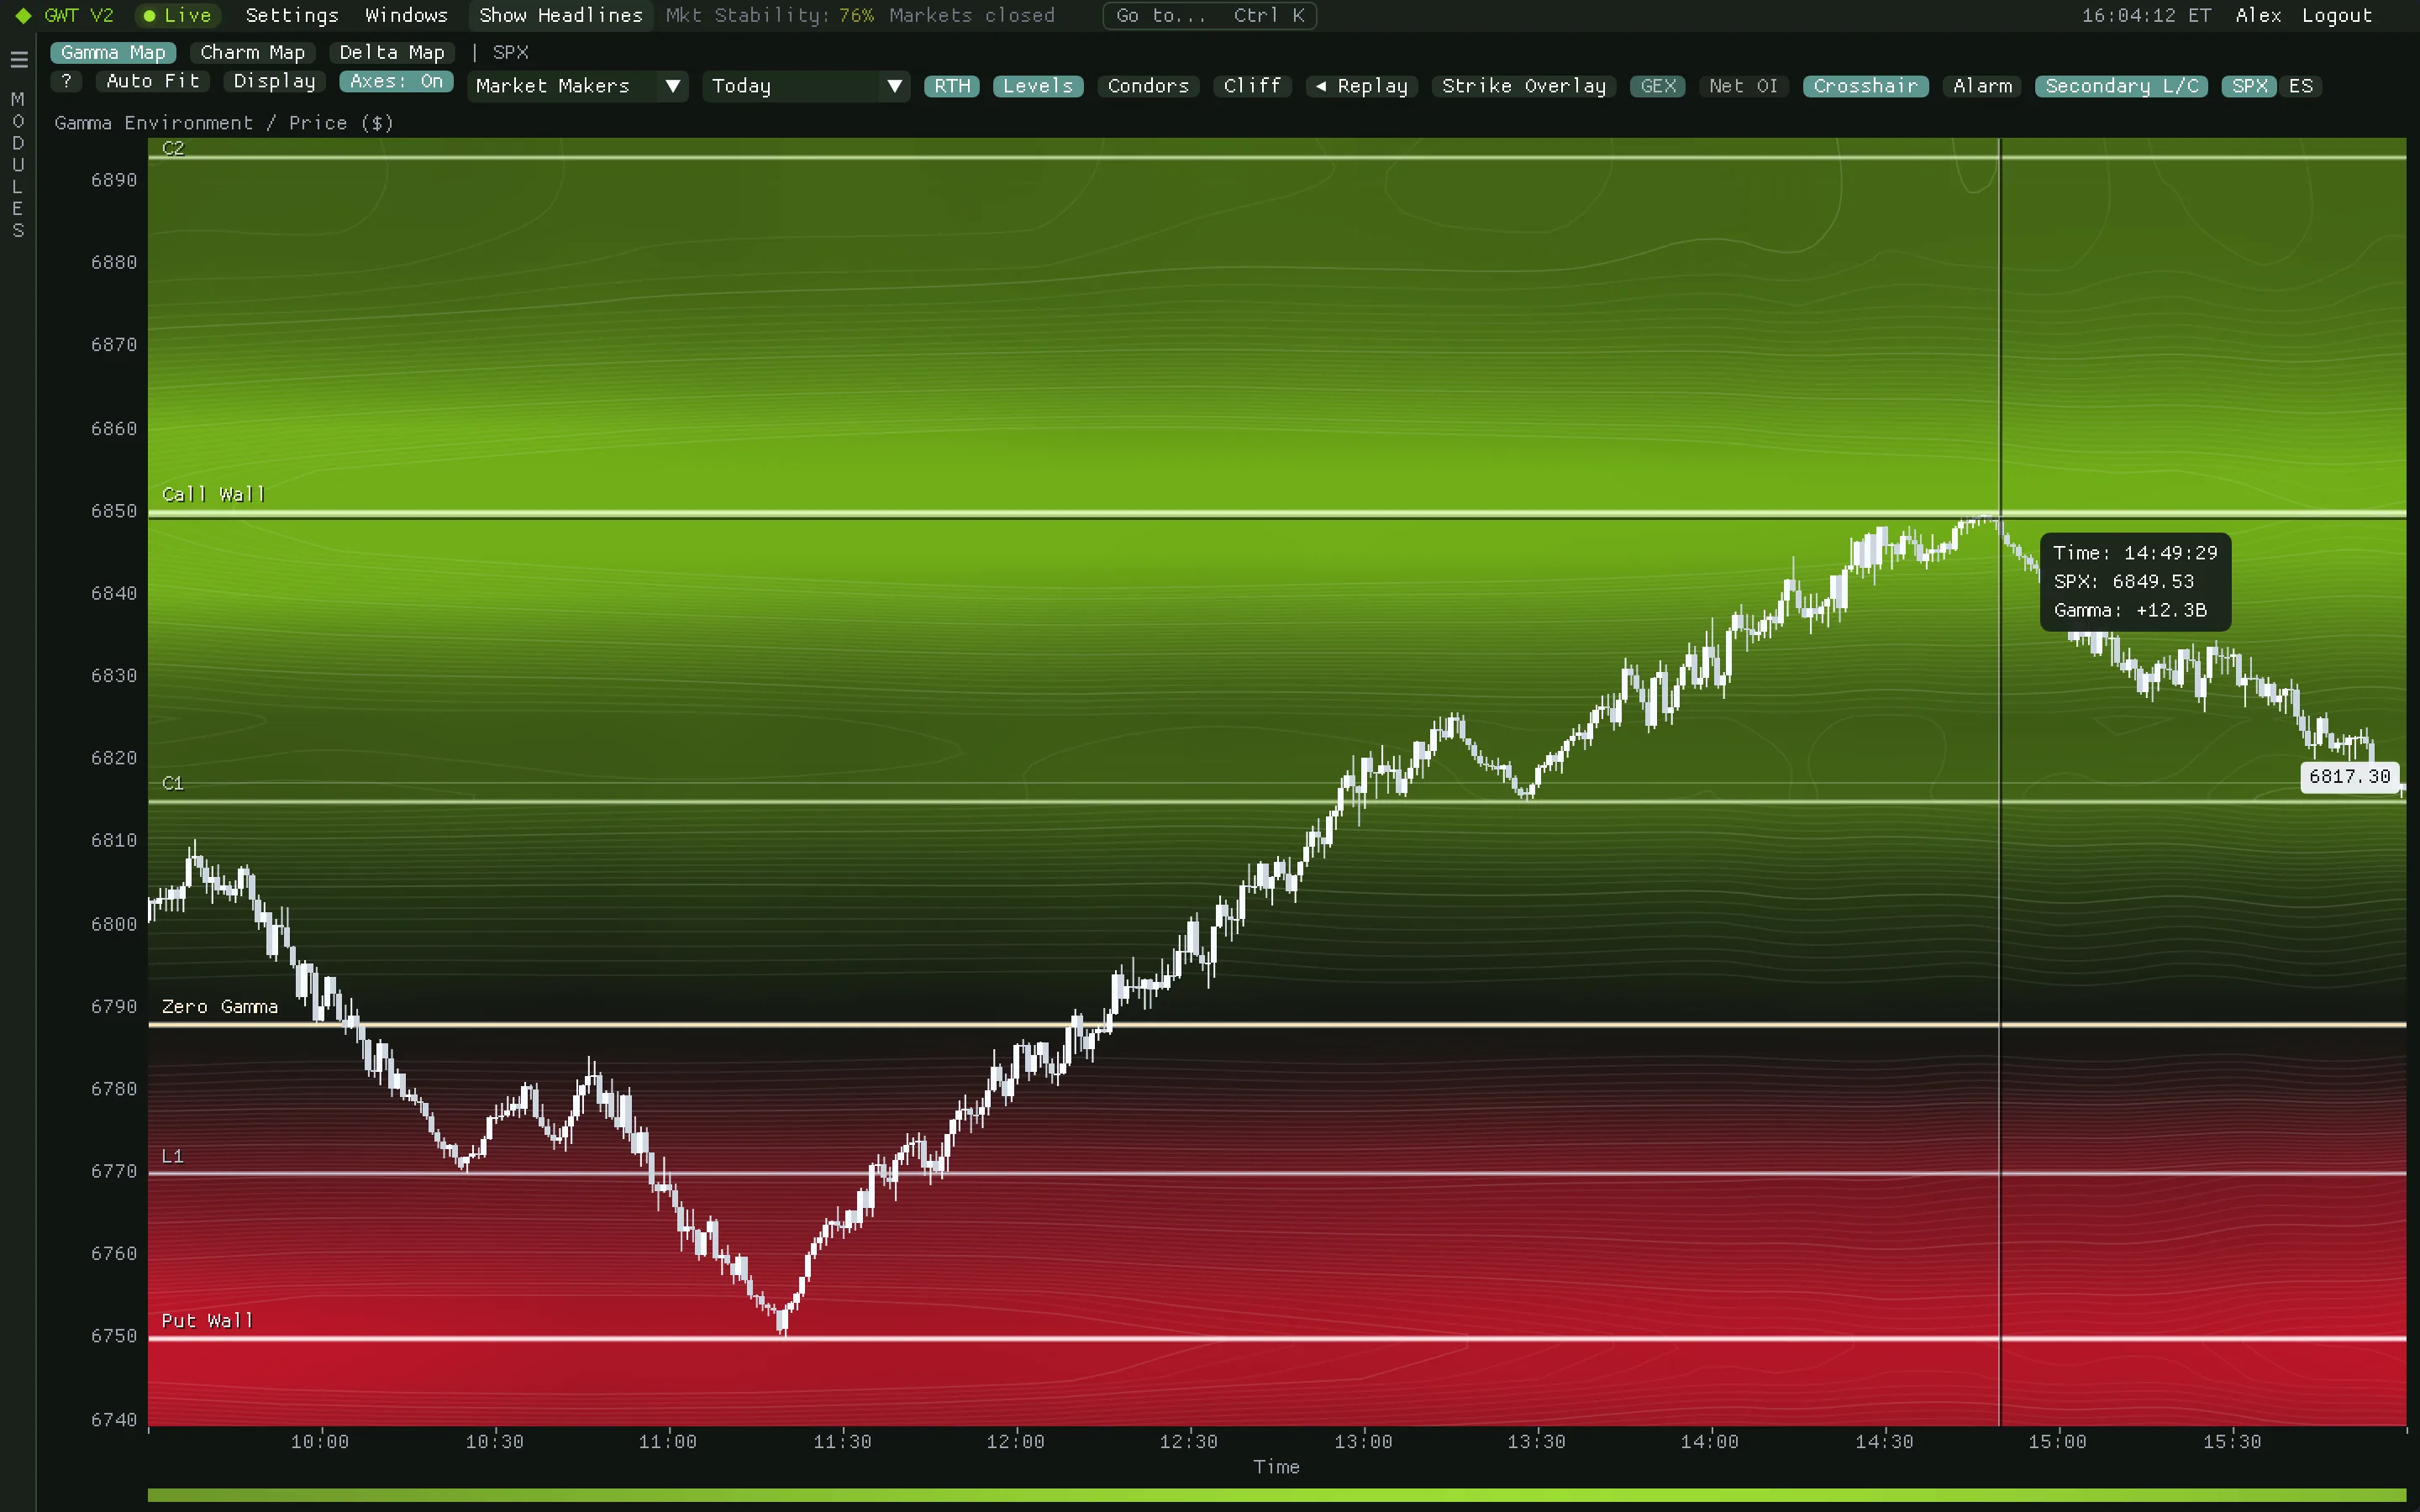
- 14:50 · Call Wall 6850
Rejected at the Call Wall
The Call Wall is the strike with the most positive dealer gamma, the brightest green on the map. In the stable regime, moves into it tend to stall; here the high stops just under it and price drifts back to C1 into the close.
Levels are where reactions are more likely, not where they are guaranteed. Price can and does trade through walls, especially when positioning shifts during the day.
Three lenses
Gamma for structure, delta for lean, charm for change.
Gamma Map
Stability, pinning and friction. Positive-gamma zones tend to damp moves; dark corridors let price travel more freely.
Delta Map
Directional pressure from options positioning, and where it weakens or reverses as price and time move.
Charm Map
The rate of change in that pressure as time passes: where it is building, fading or about to flip into the close.
Fast reading workflow
Four steps, every time.
Start at price
Find the last price marker. Is it inside a stable pocket or near the edge of one?
Look ahead in time
Scan a little to the right. A strong pocket above or below can act as a magnet or a brake.
Check the boundaries
Tight contours mean the structure changes quickly. Those edges often matter more than the middle of a zone.
Confirm with candles
Stalling, rejection or repeated closes near a zone show the market is respecting it.
The colour is context, not a trade by itself. A strong zone far away matters less than a weaker one sitting right on price, and the map works best next to flow, the tape or your own execution model.
On the map
Levels, condors, cliffs and alarms.
Everything that helps you place the structure sits in the toolbar, and every price can be shown in SPX or ES points.
- Call wall, put wall, zero gamma, max gamma, top absolute gamma and the secondary levels.
- Condors: iron-condor-shaped same-day positions found in intraday open interest.
- Gamma cliff: flags where the largest positive and negative strikes sit side by side, so crossing between them flips the hedging regime.
- Strike overlay: hover a bar to see that strike over the last hour and whether it is building or fading.
- Switch the participant: market makers by default, or broker-dealers, customers and firms.
- Alarm: drag a box on the map and a sound plays once when SPX trades inside it.
Net GEX and stability
How much room does price have right now?
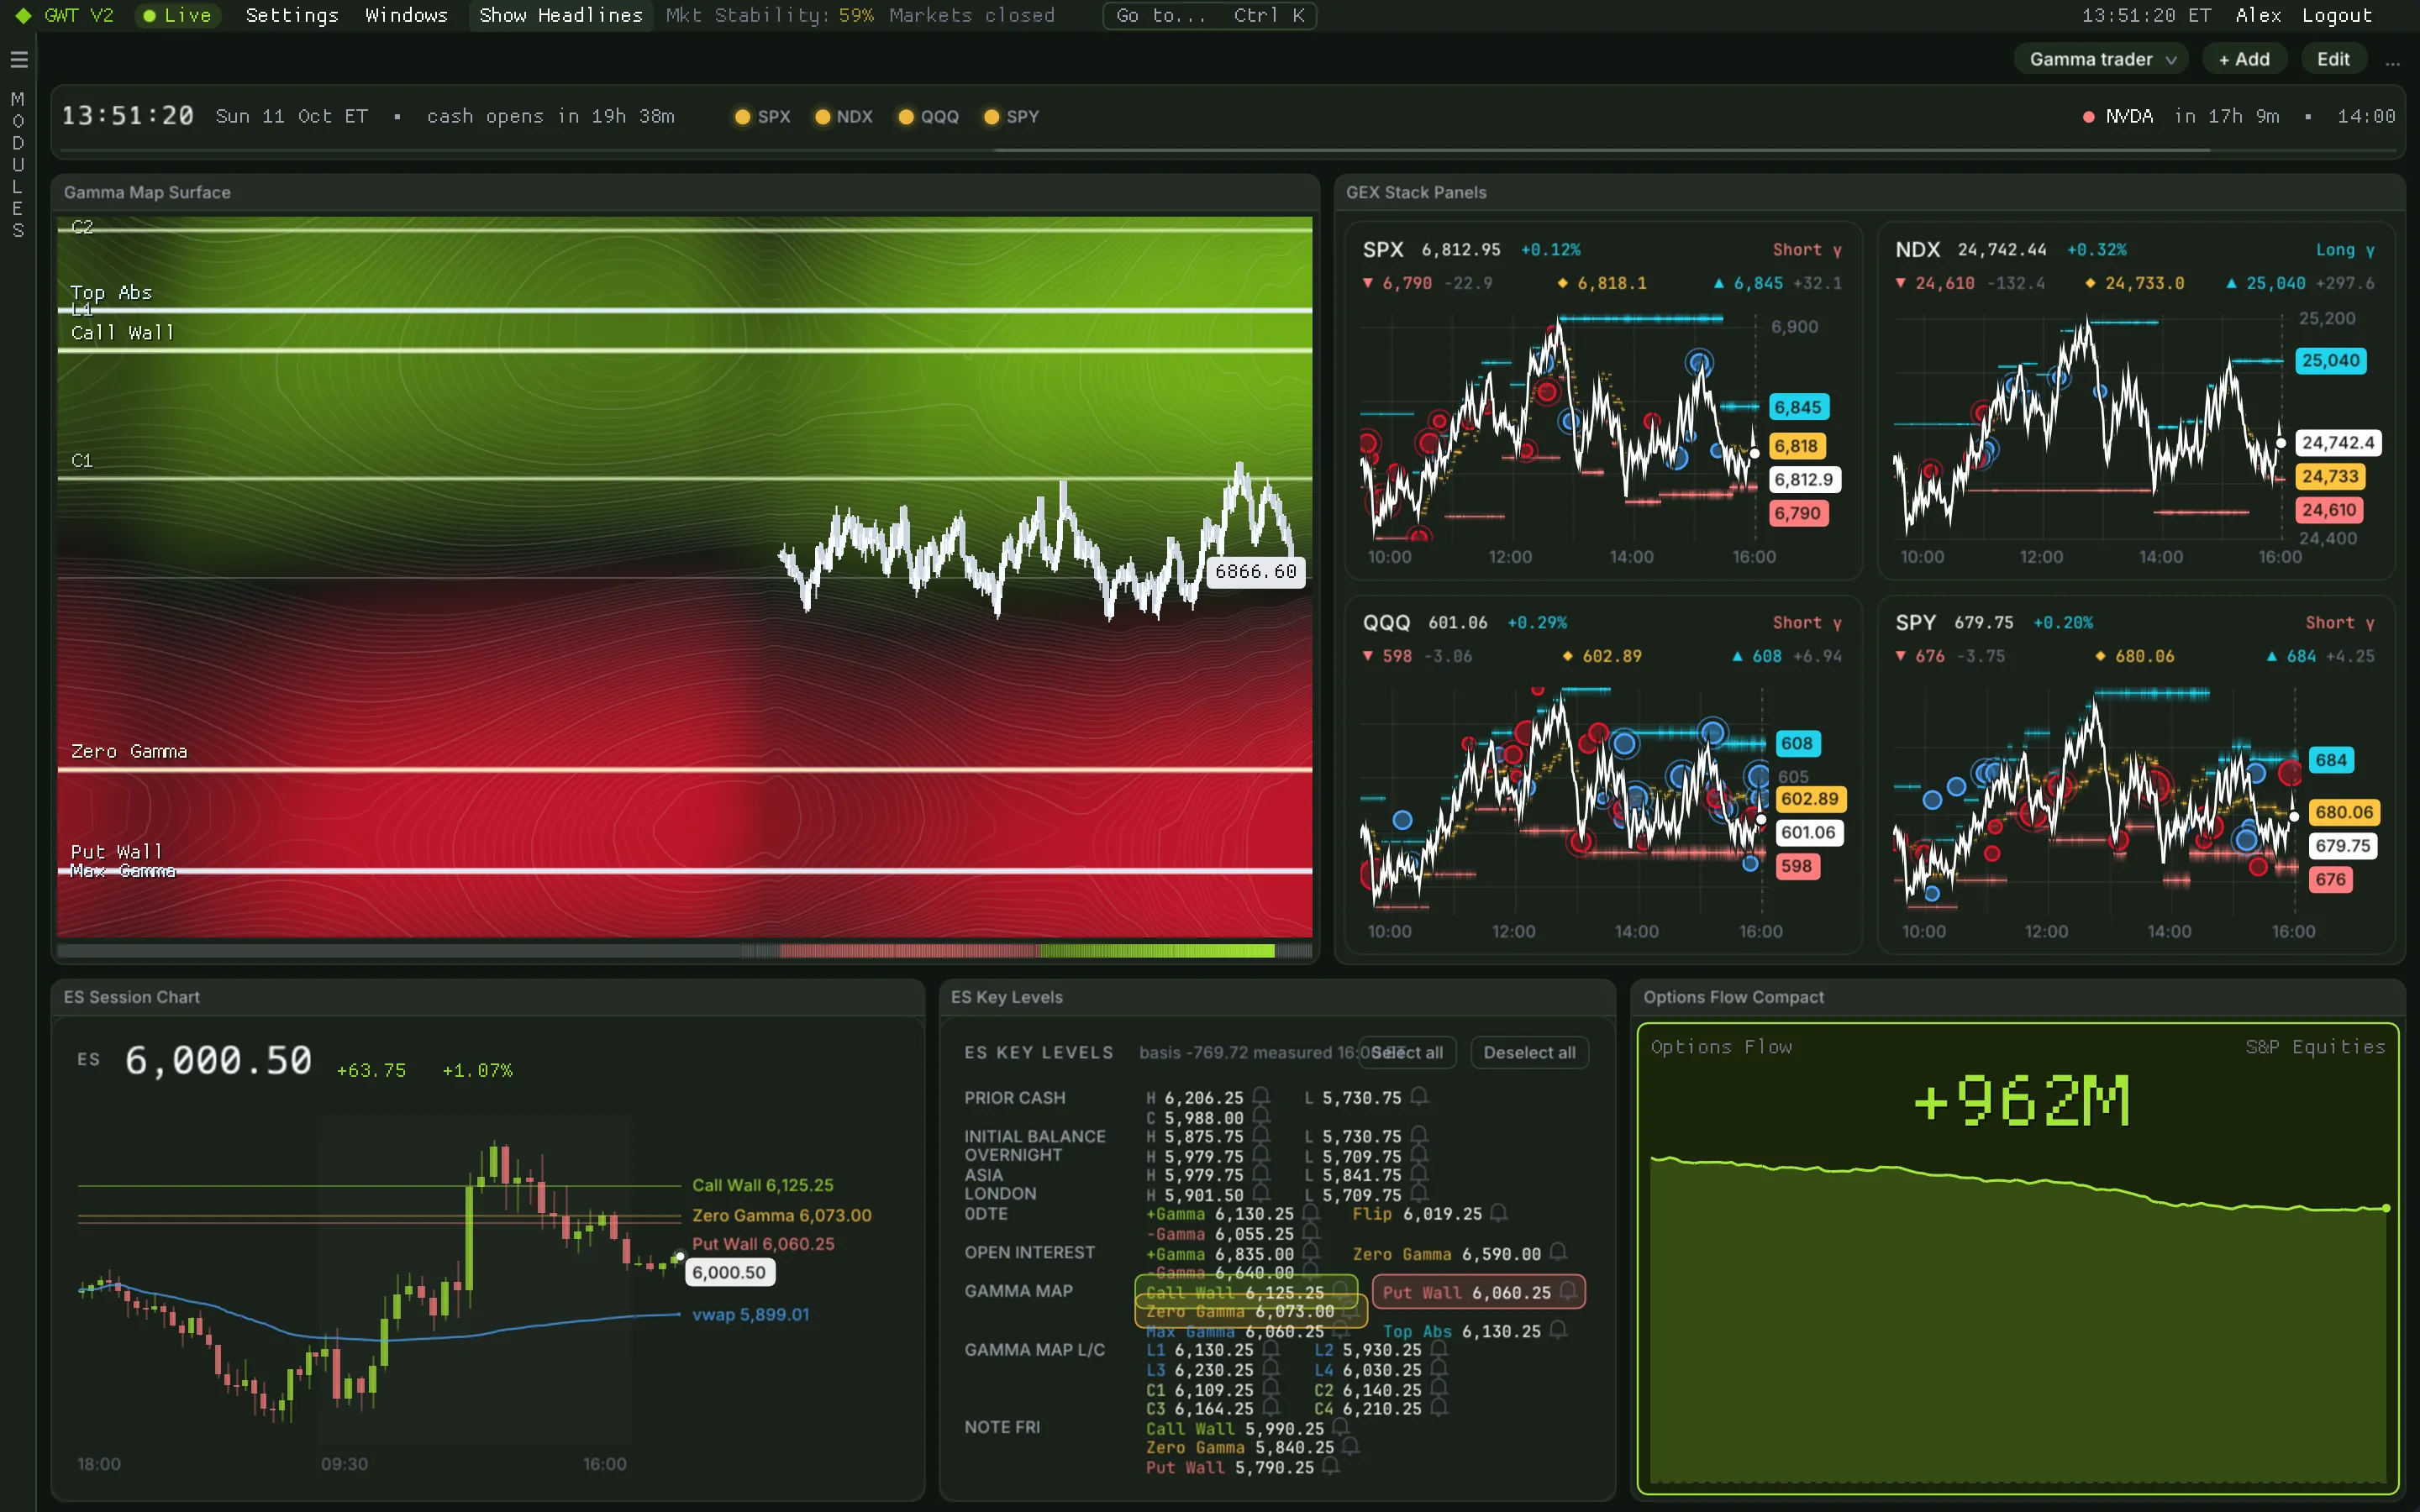
The Net GEX pane under the map tracks dealer gamma through the session alongside the options flow line. The market stability gauge, shown in the menu bar and on the map during regular hours, turns current positioning into a short-horizon volatility reading from 0 to 100%.
- A higher stability reading means a tighter expected range over the next half hour; a low one means a wider move.
- It refreshes every minute alongside the surface.
- Use it to scale targets and stops, not as a trade signal on its own.
How traders use itWhen the gauge is low and price sits in a negative-gamma zone, that is the time for smaller size or standing aside.

Keep exploring
Related modules
Ready when the open is
Put gamma, flow and liquidity on one screen.
Get your access token, download the app for your Mac or PC and paste the token at sign-in. It takes about two minutes.